LoRaWAN Water Sub-Metering Systems
Why Water Sub-Metering Matters
Hidden leaks represent real financial losses that often go undetected for months. I've worked with facilities maintaining steady monthly water bills, assuming everything operates normally. Then we install sub-meters and discover that one section accounts for 40% of total consumption, with half of that water leaking into the ground for six months before detection. The financial impact accumulates silently.
Without sub-metering, you know your total water consumption from the utility bill. What you don't know is where that water actually goes: which zones, which buildings, which processes consume it, and critically, where you're losing it to leaks. LoRaWAN meters deployed at strategic monitoring points provide this visibility. You can isolate problems within hours rather than waiting weeks for billing cycle analysis to reveal consumption anomalies.
Two Ways to Meter a Pipe
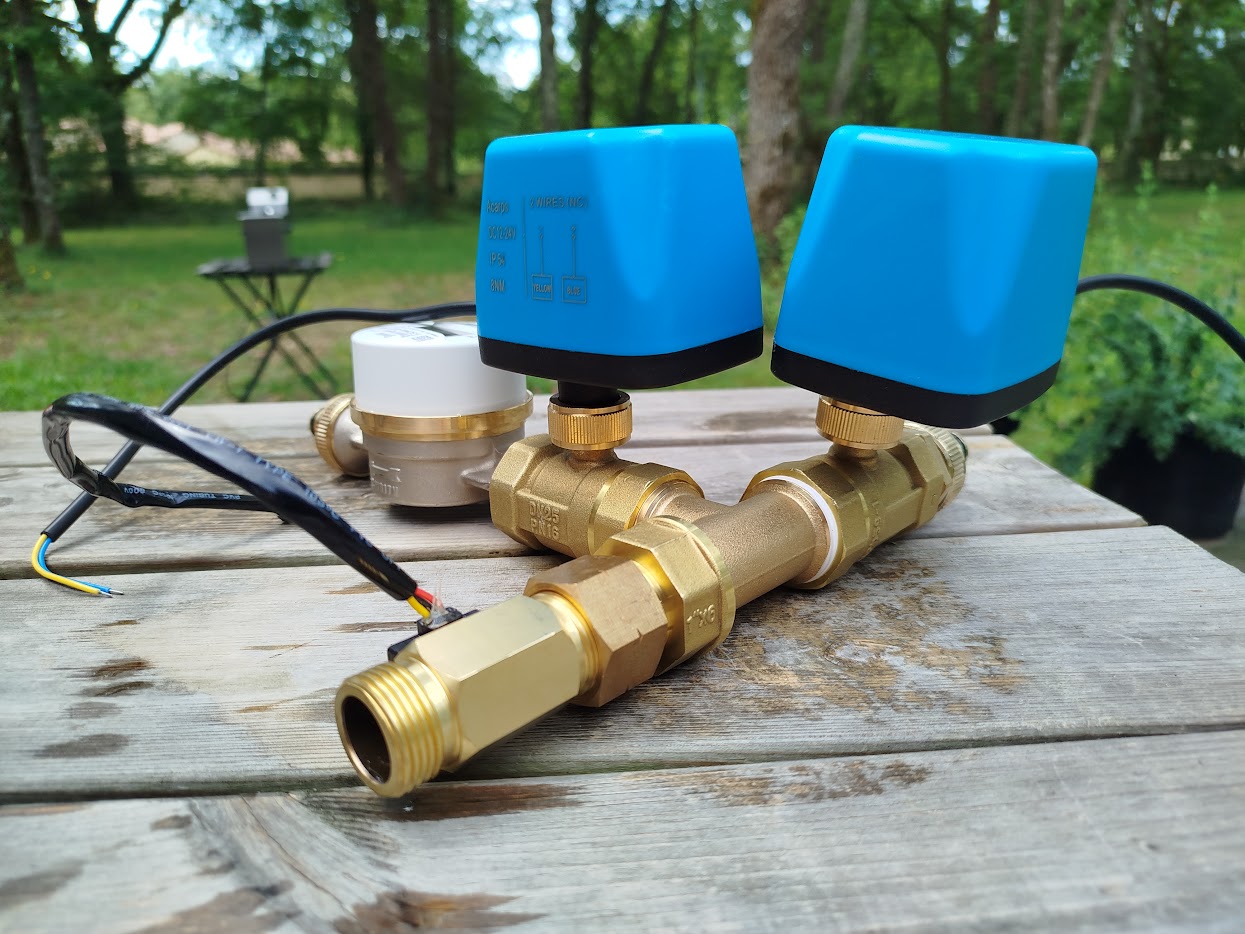
Mechanical pulse-counter meters have been around forever, and they are proven, accurate and available in sizes from DN15 up to DN300. They generate an electrical pulse proportional to flow volume, typically one pulse per liter for residential use or ten per liter where you want the resolution. A LoRaWAN pulse transmitter connects to that output and sends hourly consumption totals along with a calculated instantaneous flow rate, running 5 to 7 years on two AA lithium cells depending on how often it transmits. The catch is inline installation: cutting the pipe, threading it, coordinating a water shutoff and paying a plumber, which is why these suit new construction and permanent installations where the plumbing work is happening anyway. Budget 150 to 300 EUR for the meter plus 80 to 150 EUR for the transmitter.
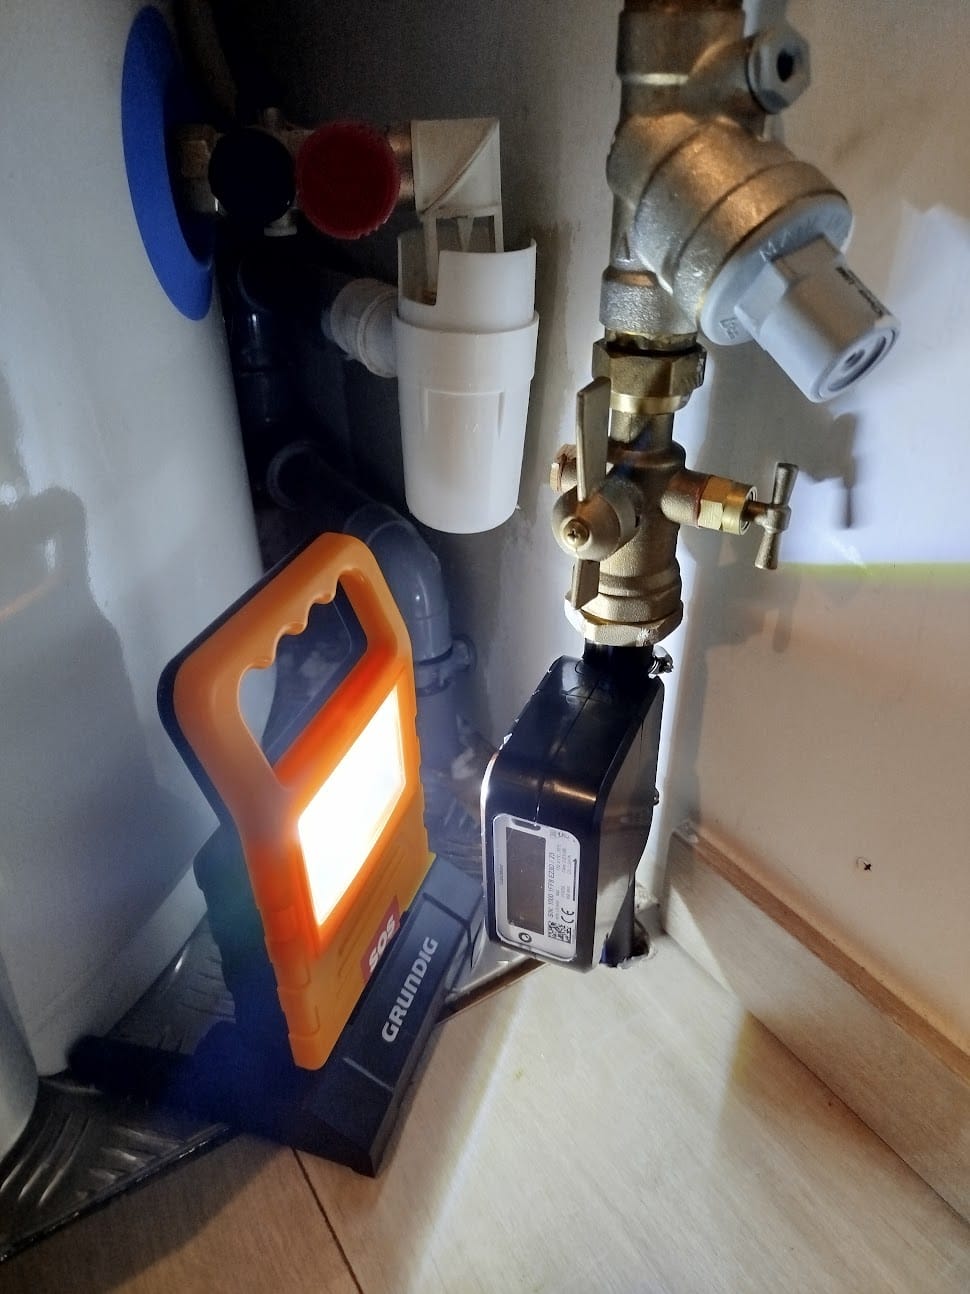
Ultrasonic clamp-on meters work completely differently. Ultrasonic waves measure flow through the pipe wall instead of using mechanical parts inside the water line, so the meter clamps onto an existing pipe with stainless steel brackets. No cutting, no shutoff, no plumber.
CubicMeter is the one I reach for most often, and it comes in two versions: white for metal pipes, covering copper from 15 to 22 mm, and black for plastic, covering PEX from 16 to 25 mm. They handle up to 66.7 liters per minute, with accuracy of ±20% on copper and ±10% on plastic. That is plenty for finding leaks and tracking consumption, since you are not billing cubic meters to three decimal places. The battery lasts up to 10 years sending hourly LoRaWAN updates and is not replaceable, so at ten years you swap the whole unit. Water temperature range is 0.1 to 70°C, which covers everything except industrial hot water systems.
What the datasheet will not tell you is that installation needs straight pipe: ten times the pipe diameter before the meter and five times after, so on a 20 mm pipe that is 200 mm clear before and 100 mm after. Turbulence in that stretch throws off the readings. Given the straight run, the actual mounting takes 15 to 30 minutes. Position the sensor, tighten the clamps, done. Cost is 250 to 300 EUR complete, with the LoRaWAN radio already inside, so there is no separate transmitter to buy.
Choosing Between Them
The decision usually makes itself once you know the building. New construction with accessible pipes favors mechanical meters, which cost less and cover a far wider range of pipe sizes. Existing buildings and retrofits favor ultrasonic, because it eliminates the plumbing work and the downtime entirely, and because a building owner who forbids pipe cutting has just made the choice for you. Multi-tenant billing favors ultrasonic too, since it installs without disrupting water service to the other units. And if leak detection is the priority rather than billing accuracy, ultrasonic gives you severity classification in the payload rather than raw flow numbers you have to interpret yourself.
The installation time gap is the part people underestimate. A mechanical meter is 2 to 3 hours per unit plus plumber costs. An ultrasonic clamp-on is 15 to 30 minutes and needs nobody but you.
Whichever you choose, connecting it to LoRaWAN rather than reading it by hand changes what the data is worth. It removes human error in dial reading, detects leaks within 1 to 2 hours rather than the 30 to 90 days between manual readings, builds the historical record that makes trends and anomalies visible at all, and removes the need for site access. Across several meters, the infrastructure often costs less than the monthly site visits it replaces.
Where the Meters Go
Most people over-monitor. You don't need 50 meters scattered everywhere. You need the right 8 to 12 meters in strategic locations. The main supply line catches total leakage. Each major process or building isolates its own consumption. Suspicious areas get monitored based on what the initial assessment reveals.
I do a one-hour site walkthrough, and a video call works fine, since you can just walk around with your phone, and mark exactly where the meters should go. That prevents both under-monitoring, which misses the leak sources, and over-monitoring, which spends money on redundant data points.
Catching Leaks, and How Fast
Most LoRaWAN meters detect leaks by watching overnight consumption. If water flows when the facility is closed, you probably have a leak. That works, but it requires establishing baseline patterns and setting thresholds by hand for each location.
Modern ultrasonic meters classify severity themselves, from flow rate and duration, which is more useful than it first sounds. A small leak is 1 to 9 liters per hour seen over several days, which is a dripping tap, a slow toilet flapper or a weeping fixture, and the meter reports it as a continuous low-level pattern. A medium leak is anything over 9.6 liters per hour sustained for 40 minutes or more, meaning a running toilet, a minor pipe leak or a failing valve, and it raises an active leak alert. A burst is over 1,500 liters per hour for 5 minutes or more, which is a broken pipe or a failed connection, and it demands an emergency response.
That classification is what turns alerts into a work queue. Burst means drop everything. Medium means investigate today. Small means schedule it into this week's maintenance.
Detection speed is where the money actually is. Manual readings discover leaks 30 to 90 days after they start, daily automated readings find them within 24 hours, and hourly LoRaWAN transmissions catch them in 1 to 2 hours. Put numbers on a modest 50 liter per hour leak and the gap is stark: a 30 day delay wastes 36,000 liters, a 24 hour delay wastes 1,200, and a 2 hour delay wastes 100.
What the Data Shows
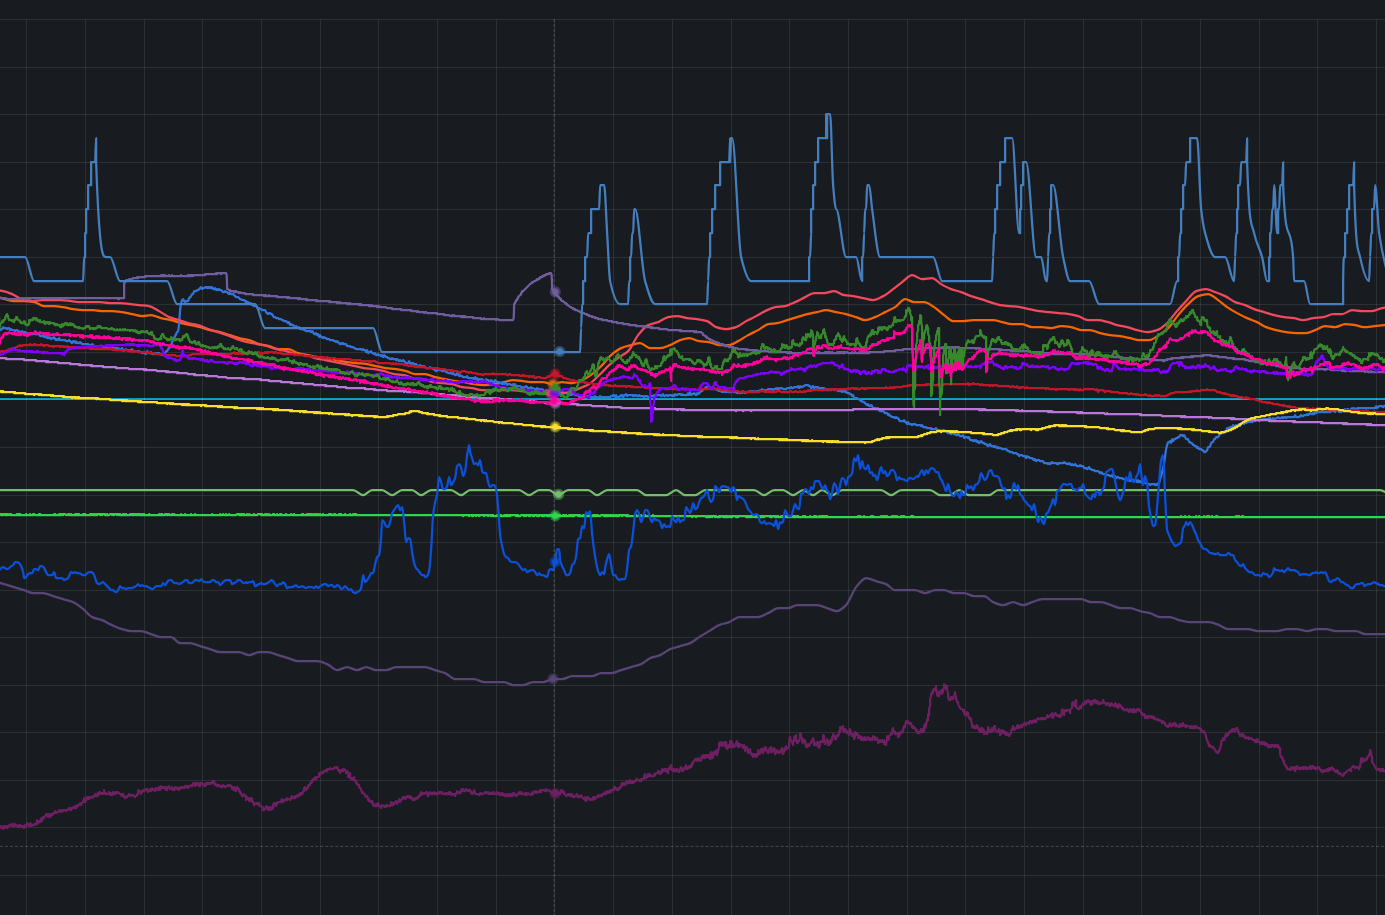
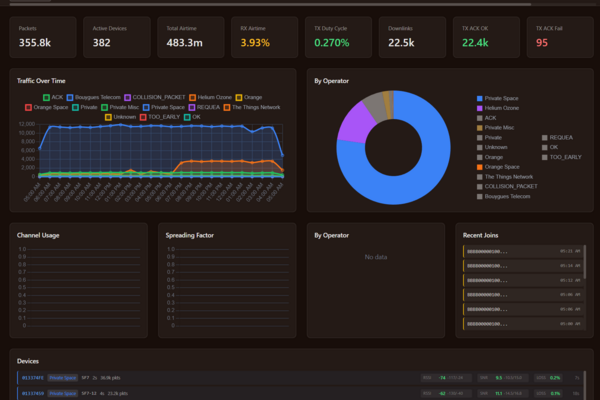
Dashboards should show what drives a decision: current flow rate against normal range bands, consumption trends by day, week and month, overnight flow as the standing leak indicator, cost tracking against your actual water rates, and alerts on abnormal patterns.
A real alert reads like this. "Zone 3 showing 45 L/hour at 2 AM, normal is under 5 L/hour. Possible leak." You get the alert, send someone to check, find the running toilet or the leaking valve, and fix it. Without the monitoring, that leak runs for weeks until the next utility bill reveals it.
The demo dashboard has water meters and a leak sensor reporting on it, so you can pull the range back a few days and see what the overnight baseline actually looks like on a live installation.
Where This Gets Deployed
Industrial cooling systems benefit most from strategic placement that maps flow through the whole circuit. Overnight consumption analysis frequently reveals operational issues rather than leaks as such: pumps that fail to shut down properly off-hours, cooling tower losses that show up as continuous low-level flow, and process equipment faults that quietly raise consumption. Several monitoring points let you identify which of those it is, instead of waiting for a utility bill to tell you something got worse.
Agricultural operations often face a discrepancy between the water they pay for at the supply point and the water actually delivered at the field gate. Meters across irrigation channels measure delivered volume against supplier billing, and the discrepancies are surprisingly common: losses in distribution infrastructure, calibration differences between meters, and unauthorized draws from supply lines. Sub-metering produces documentation that either validates the billing or proves it wrong, which is the only thing that moves the conversation. This pairs naturally with irrigation control on the same network.
Municipal distribution systems lose a percentage of pumped water before it ever reaches a customer's billing meter. A network of meters placed through the distribution system identifies which zones lose the most, so repair work is prioritized by measured impact rather than by whichever failure became visible first, and losses come down steadily as the worst locations are fixed.
Multi-tenant buildings are the other common case. Individual apartments or commercial units each get a meter, a central dashboard shows consumption per unit, and billing integration removes the monthly walk around reading dials. Tenants see their real usage, landlords bill accurately, and disputes drop to almost nothing. RV parks and campgrounds work the same way with a hookup in place of a unit, letting you charge for actual usage instead of a flat rate that penalizes light users, and catching running taps on unoccupied sites before the monthly bill shows thousands of liters gone. Inside industrial facilities the same approach sub-meters production lines and processes, which is what lets an efficiency investment be justified with data rather than with a guess about where the water goes.
Why LoRaWAN Carries It
Traditional sub-metering needs cable run from every meter back to a central collector, and that cost is what usually kills the project at the quotation stage. LoRaWAN operates on sub-GHz spectrum, 868 MHz in Europe, 915 MHz in North America and regional equivalents elsewhere, and those signals penetrate concrete and reach 1 to 5 km in urban environments. You put meters where the water is rather than where the cabling can reach.
Battery life does the rest. Meters transmitting hourly last 5 to 10 years, so no meter location needs mains power, and nobody goes hunting for an outlet in a utility room or runs a spur to a basement. Adding meters later is provisioning rather than construction: one gateway covers an entire building complex or RV park, and new meters simply join the network with no rewiring and no reconfiguration.
Designing the System
Gateway placement wants a central location with clear sight lines to the meters, and a basement or utility room is often fine. Thick concrete floors change the answer, and then it is either one gateway per floor or an external antenna mounted higher up.
Transmission interval is the main trade-off you control. Hourly transmissions give 7 to 10 year battery life; every ten minutes drains the same battery in 2 to 3 years. Most applications are fine hourly, because you are tracking consumption and catching leaks rather than controlling a process in real time.
For the network server, self-hosted ChirpStack gives full control with no per-device fees and runs on any VPS, The Things Network is free within fair use limits, and commercial providers cost more but come with an SLA and support.
The data path runs from gateway to network server to time-series storage to Grafana or a custom dashboard. What arrives depends on the meter. Pulse-counter meters send cumulative pulse counts, so you derive flow rate from the interval between them and store both the running total and the calculated rate. Ultrasonic meters send flow directly in liters per hour along with cumulative volume, and the leak classification arrives in the payload, so there is nothing to compute.
The alerts worth building are narrow: flow detected in an unoccupied unit, consumption well outside its usual pattern, any medium or burst alert from an ultrasonic meter, and a meter that has not transmitted in 24 hours, which means a dead battery or a coverage problem rather than a water problem.
What Goes Wrong
Undersized gateway coverage is the most common failure, usually one gateway expected to cover a large multi-story building with thick concrete floors, leaving meters in the basement or the far wing unable to reach it. Do a coverage test before buying hardware, or plan for several gateways from the start.
Choosing the wrong meter type kills projects before they begin, typically by specifying mechanical meters that need pipe cutting in a building whose owner forbids plumbing work. Ultrasonic clamp-on meters exist for exactly that situation.
Sizing is its own mistake: a DN15 meter on a line that wants DN25 causes excessive pressure drop or inaccurate readings at high flow. Size for the expected flow range rather than for the lowest price.
Resolution catches people out in a subtler way. A meter at 10 liters per pulse cannot detect a dripping tap, because the drip never accumulates a pulse between readings. Leak detection wants 1 liter or 0.1 liter per pulse, and ultrasonic meters measure continuous flow, which catches smaller leaks more reliably than any pulse counter.
Calibration drift is the slow one. Mechanical meters start around ±2% and can reach ±10% after 5 to 7 years, so either schedule calibration checks or plan a replacement cycle. Ultrasonic meters hold accuracy longer but still deserve periodic validation.
And finally, installation effort. Mechanical meter installation is not a quick DIY job: pipe cutting, threading, fitting, shutoff coordination, 2 to 3 hours per meter plus the plumber. If that surprises you halfway through a rollout, the schedule is gone.
Billing Integration
How far to automate depends on the size of the deployment. The manual route exports monthly consumption as CSV for import into billing software or hand-written invoices, which is perfectly adequate for a handful of meters. Semi-automated generates the reports on a schedule and sends them to billing staff, who review for anomalies, a burst alert mid-month for instance, before invoices go out, and that balance of automation and oversight suits most buildings. Fully automated connects the metering database to the billing system through an API, generating invoices from rate tables with exception handling for unusual consumption, which is what scales to hundreds or thousands of meters.
ROI Reality
Typical payback periods, driven mostly by leak reduction, run 8 to 14 months for industrial and commercial sites, 12 to 24 months for agricultural operations, and 18 to 36 months for municipal systems, which usually have regulatory drivers on top of the cost case.
Need Help With Your LoRaWAN Deployment?
Water metering projects tend to start with a simple question, who is using what, and grow into billing, leak detection, and conservation programs. I help at every stage: choosing between mechanical and ultrasonic meters, planning gateway coverage, building the data pipeline and dashboards, and wiring consumption data into billing. Everything comes with source code and documentation, so the system stays yours.
Talk to an expert about your metering rollout.
Working on a LoRaWAN project?
If this article touches on something you're building, tell me about it. The first conversation is free, and you'll get an honest read on the right approach for your situation.
Book a Free ConsultationCurious what the finished thing looks like? Open the live demo dashboard