Open Source LoRaWAN Traffic Analyzer
Why Monitor LoRaWAN Traffic
Running a few gateways gives you a window into everything happening on the LoRaWAN spectrum in your area, not just your own devices but every transmission your gateways pick up. Most people never look at this data. They configure their devices, check that uplinks arrive, and move on.
That's a missed opportunity. Your gateways hear traffic from dozens of operators and hundreds of devices. Understanding who's transmitting, how often, on which channels, and at what spreading factors reveals how congested the spectrum actually is in your area. It also catches problems with your own devices (packet loss, drifting frame counters, unexpected spreading factor changes) before they become outages.
Most LNS platforms show you your own devices well, but don't give you the full picture of everything your gateways receive. I built an open-source traffic analyzer that does.
The analyzer is open source and available on GitHub: https://github.com/1rabbit/lorawan-analyzer
What It Does
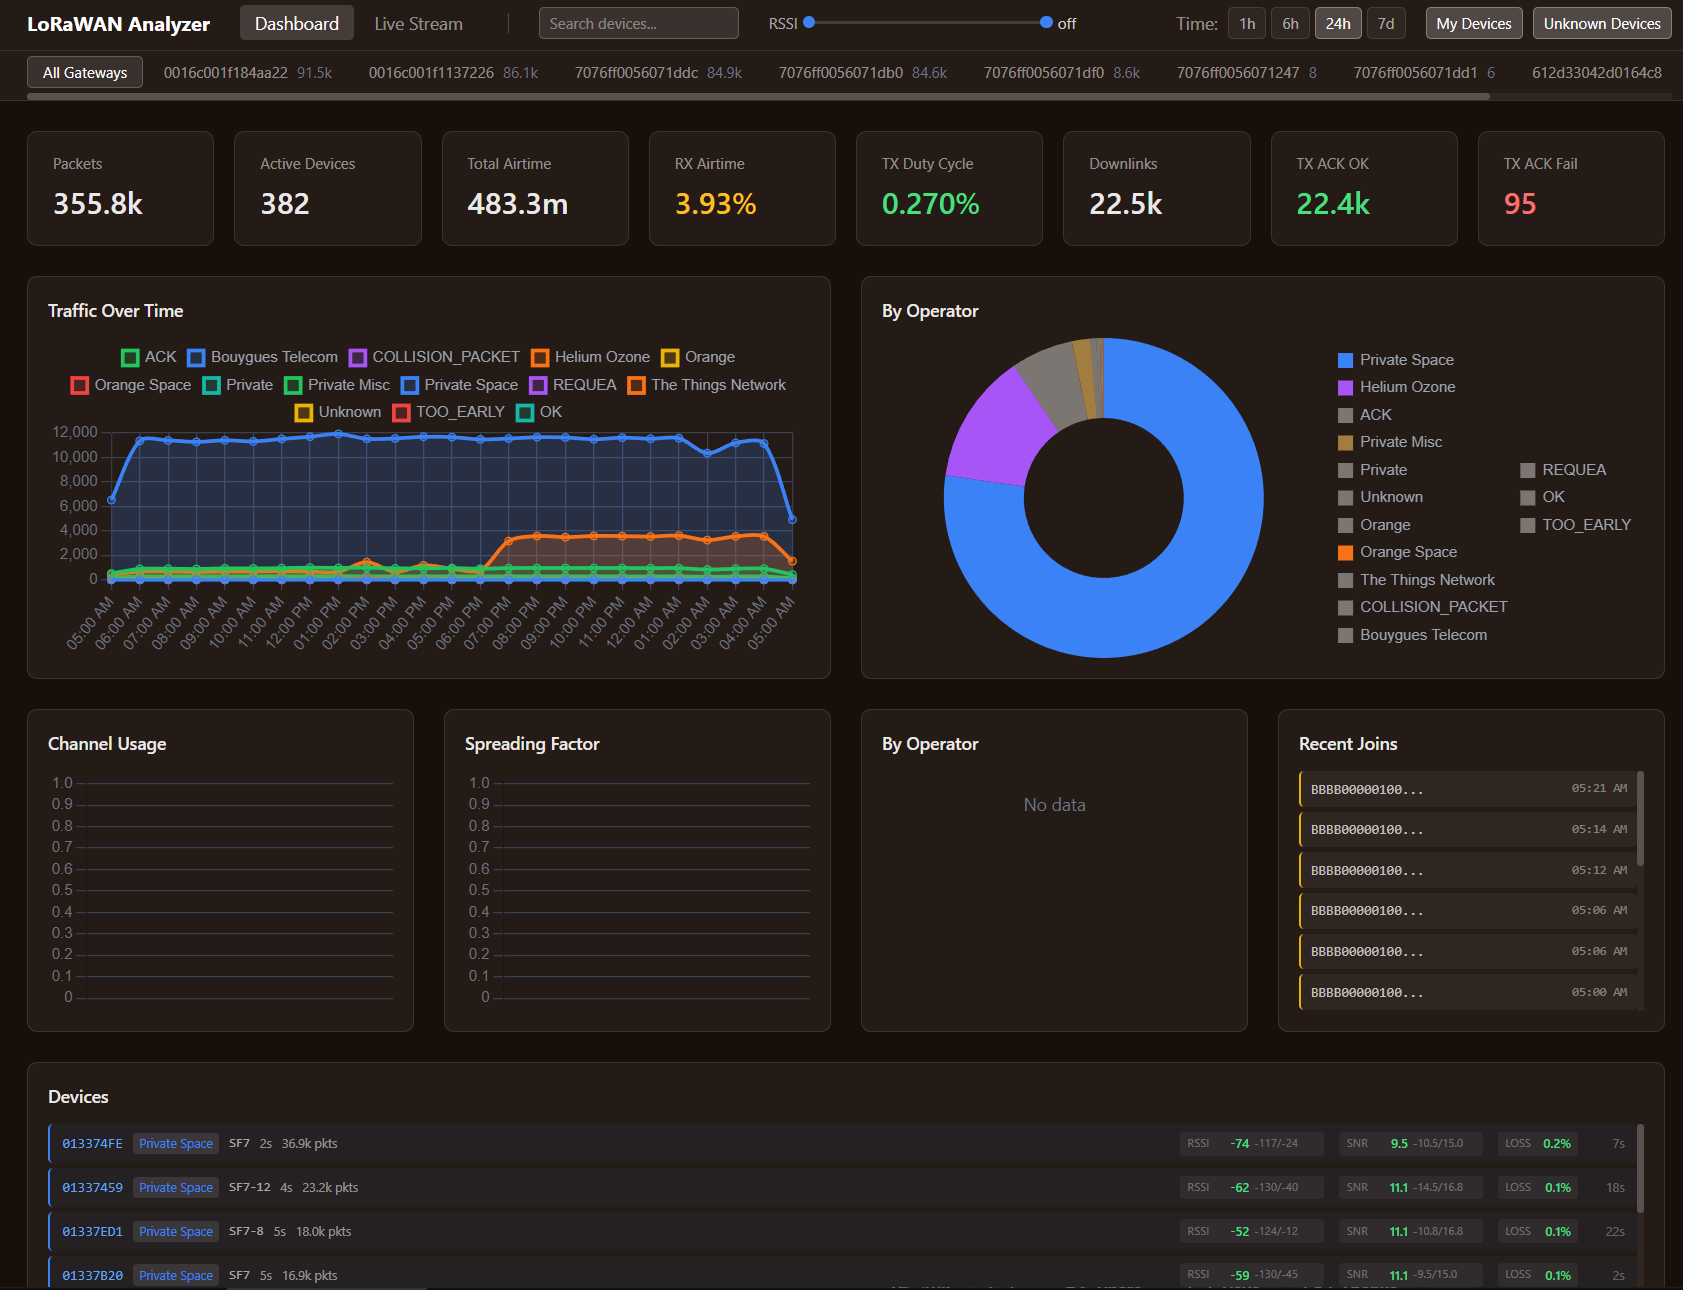
The analyzer connects directly to your LoRaWAN MQTT broker, captures all gateway events (uplinks, downlinks, join requests, TX acknowledgements), stores them in Postgres + TimescaleDB, and serves a web dashboard. It works with any gateway on any LNS (ChirpStack, TTN, Helium, etc.), with additional application-level enrichment available for ChirpStack. If your gateways speak different protocols or feed several servers, the companion LoRaWAN multiplexer can hand the analyzer a passive copy of everything it routes.
Navigation starts from a tree view that organizes traffic by gateway, then by operator, then by individual device. Every device address is mapped to its operator automatically, using the built-in LoRa Alliance NetID database covering more than 175 of them, so you can see at a glance which operators have devices within earshot of your gateways and how much traffic each one generates. Custom prefix rules let you label your own networks, which is what separates "my devices" from foreign traffic consistently in every view.
Drilling into any device, yours or someone else's, gives frame counter timelines with gap detection that reveals packet loss, RSSI and SNR trends over time, transmission interval histograms, and distributions across spreading factors, frequencies and gateways. On your own devices that is diagnostic data. On foreign ones it is a window into how other operators' deployments behave in your area, which is not information you can get any other way.
Above the individual devices, the spectrum view aggregates channel usage distribution, spreading factor breakdown and duty cycle tracking across all your gateways. It answers the question every LoRaWAN operator should be asking and few can: how busy is the spectrum here, and which channels are worst?
Join requests get their own treatment, grouped by JoinEUI with manufacturer lookup and a timeline, which is how you spot a device that keeps re-joining because something is wrong with its link, or notice new devices appearing in your area. The analyzer also correlates join requests with the data uplinks that follow, tracking sessions, and calculates airtime per packet so the duty cycle accounting is accurate rather than estimated.
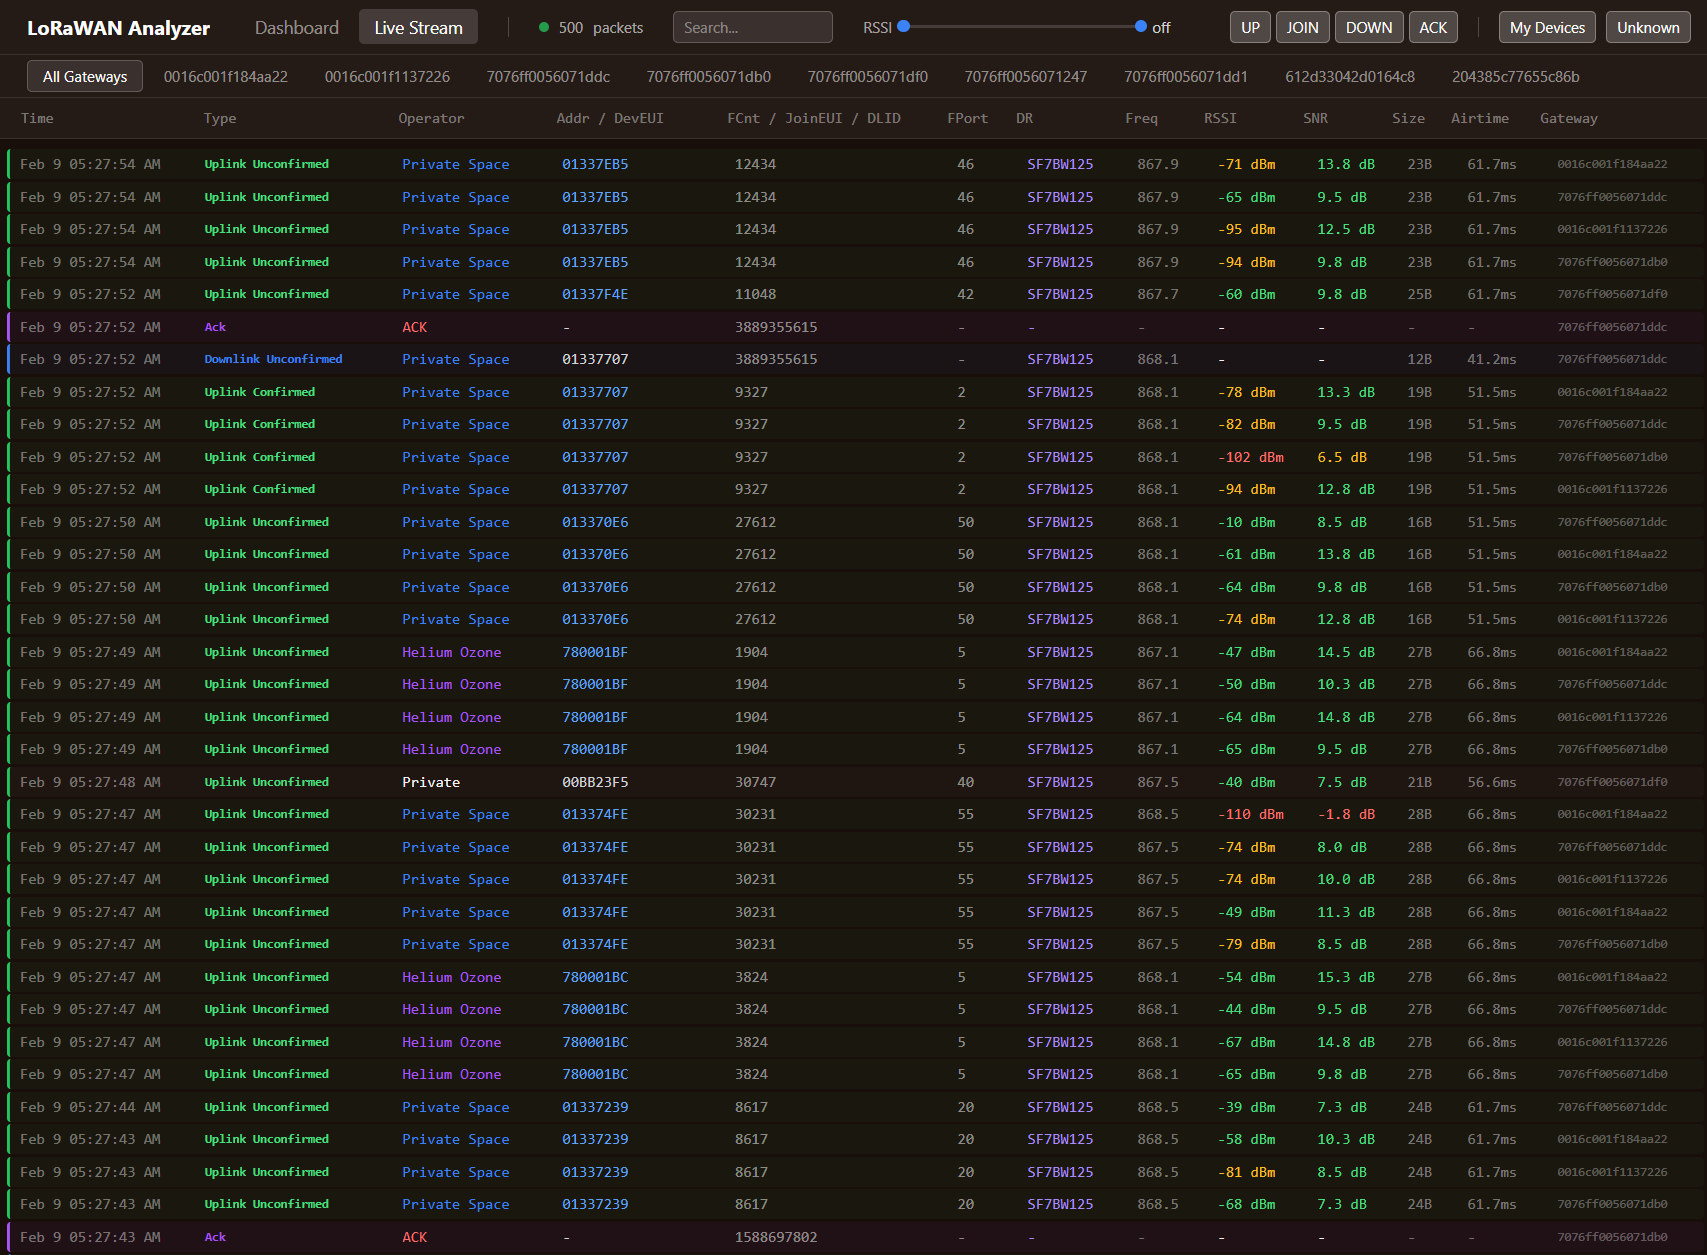
For anything happening right now there is a live feed: a WebSocket stream showing every packet as it arrives, filterable by packet type, RSSI range or ownership. That is the view you keep open while commissioning devices or chasing a fault.
Setup
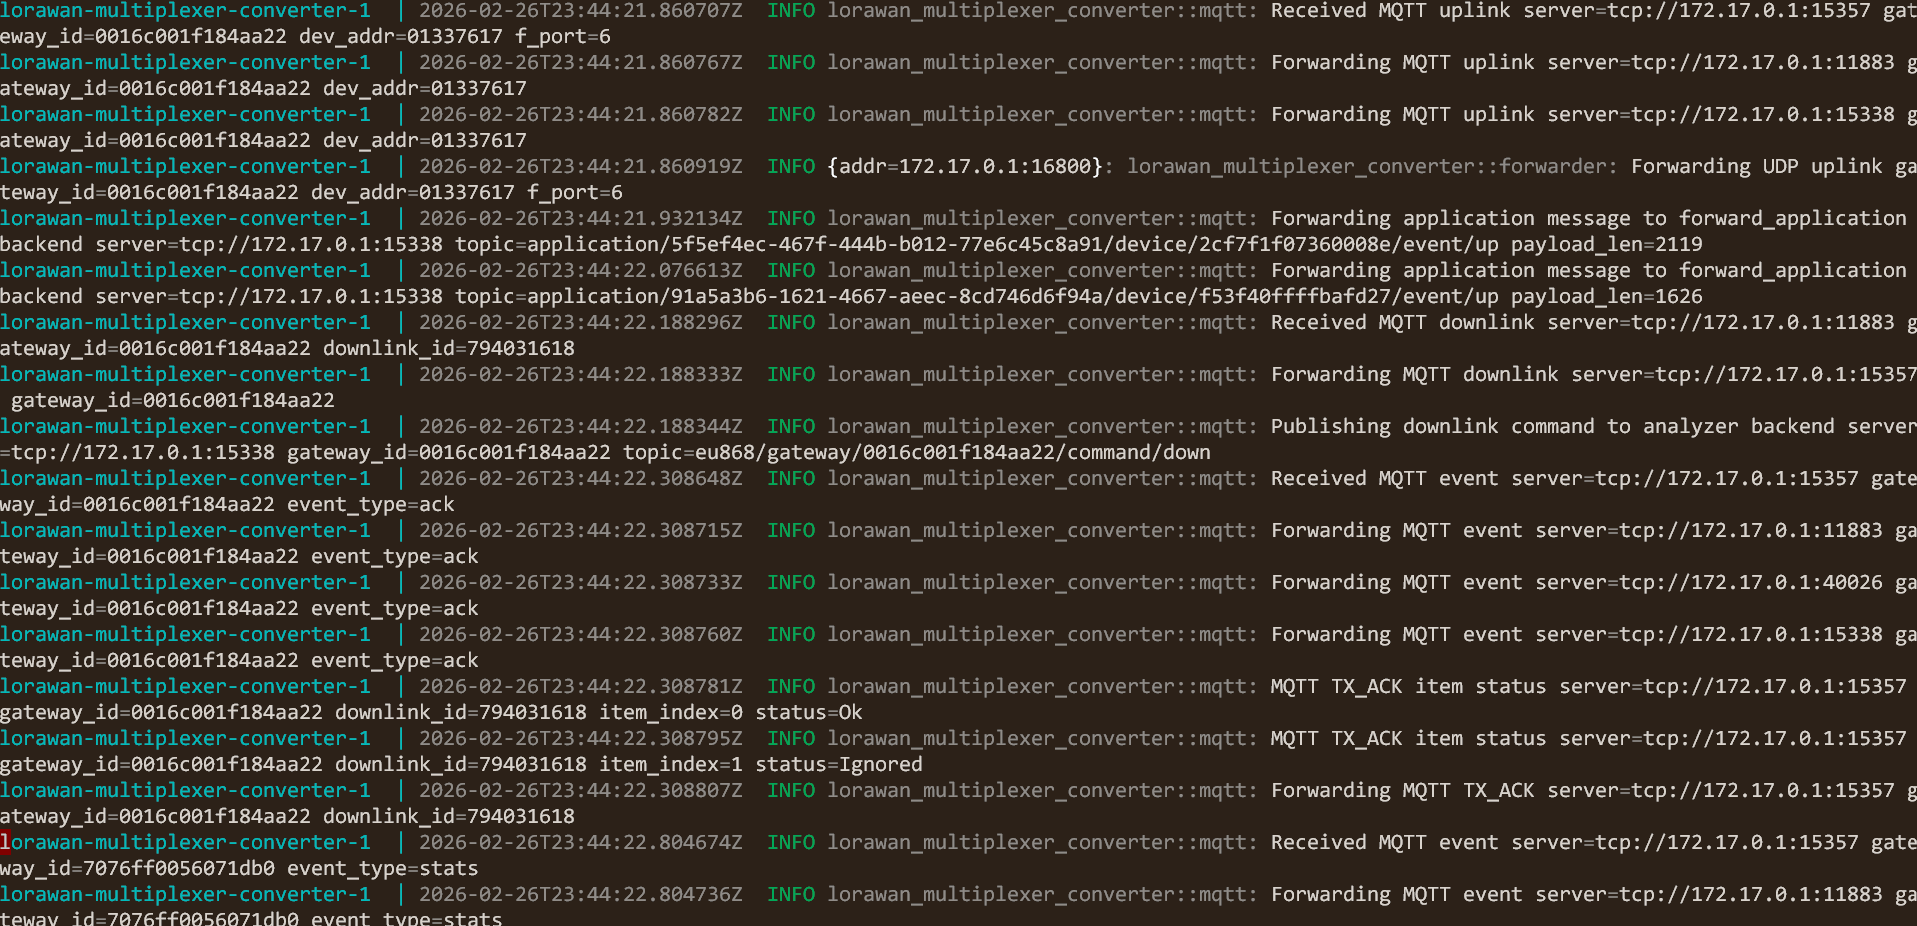
Three commands. The analyzer runs as Docker containers alongside your existing installation.
cp config.toml.example config.toml
# edit mqtt.server to point at your MQTT broker
docker compose up -d
This starts two containers: the analyzer (web dashboard + API on port 15337) and Postgres + TimescaleDB (time-series storage, internal only). Dashboard is at localhost:15337. Packets appear as soon as gateways publish to the broker.
The analyzer connects to the LoRaWAN MQTT broker you already run, so there is no extra MQTT server to stand up:
[mqtt]
server = "tcp://your-mqtt-broker:1883"
format = "protobuf"
Supports both protobuf (ChirpStack v4) and JSON (v3) message formats.
Defining your own networks is what separates your traffic from everyone else's throughout the interface:
[[operators]]
prefix = "26000000/20"
name = "My Network"
known_devices = true
color = "#3b82f6"
Technical Stack
The backend is Node.js and TypeScript on Fastify, storing packets in Postgres with TimescaleDB, which handles millions of them without difficulty. The frontend is vanilla JavaScript and Chart.js, deliberately without a framework, because the packet feed has to stay responsive while several thousand rows a minute arrive. The whole thing deploys as Docker Compose with no external dependencies.
Use Cases
The most valuable use is the one that happens before you buy anything. Assessing spectrum congestion means knowing how busy the band already is where you intend to deploy, and the analyzer shows channel usage, spreading factor distribution and duty cycle across all the traffic your gateways hear rather than just your own. That drives real decisions: what transmission interval the devices can afford, which spreading factors are realistic, and whether the gateway capacity you planned survives contact with the neighbors.
Once a network is running, the same data becomes troubleshooting. Frame counter gaps reveal packet loss. RSSI and SNR trends over weeks expose environmental change affecting coverage, whether that is a new building, vegetation growing into the path, or an antenna degrading. Interval histograms show whether devices transmit on schedule or drift. And spreading factor distributions flag devices that have fallen back to SF12 when they ought to be sitting on SF7, which is the single most expensive thing a device can quietly start doing.
Watching foreign traffic is the part with no equivalent elsewhere. The operator database maps every device it hears to a network, so you can track how many devices each operator runs, what their traffic patterns look like, and what share of the shared channel capacity they consume. In a dense deployment that is not curiosity, it is capacity planning.
And during commissioning, the live feed simply lets you watch packets arrive while you install. You confirm the device joined, that it transmits at the interval it should, and that its signal quality is reasonable, without switching between tabs or waiting for a dashboard to refresh.
What I Provide
The analyzer is open source, MIT licensed, and available on GitHub; anyone can run it. If you want it working against your own infrastructure, I handle deployment and configuration, custom operator mapping, multi-site aggregation, and integration with whatever Grafana or alerting setup you already have. The more interesting work starts once data flows in: reading the traffic your gateways capture, assessing spectrum congestion, and turning the patterns into concrete optimization decisions for your network. All of it stays self-hosted, with the collected data in your own Postgres + TimescaleDB database and no recurring fees.
Working on a LoRaWAN project?
If this article touches on something you're building, tell me about it. The first conversation is free, and you'll get an honest read on the right approach for your situation.
Book a Free ConsultationCurious what the finished thing looks like? Open the live demo dashboard