Why You Should Run Your Own LoRaWAN Network Server with ChirpStack
The Network Server Is the Brain of Your Deployment
Every LoRaWAN deployment has the same architecture: devices transmit to gateways, gateways forward packets to a network server, and the network server handles everything that makes the network actually work. Device authentication, deduplication, adaptive data rate, MAC command scheduling, downlink queuing, and roaming all run on the network server.
The network server is the single most important software component in your LoRaWAN infrastructure. It decides which devices are allowed on your network, how their data is processed, where it goes, and how the network optimizes itself. Whoever controls the network server controls the deployment.
So why would you hand that control to someone else?
What ChirpStack Actually Is
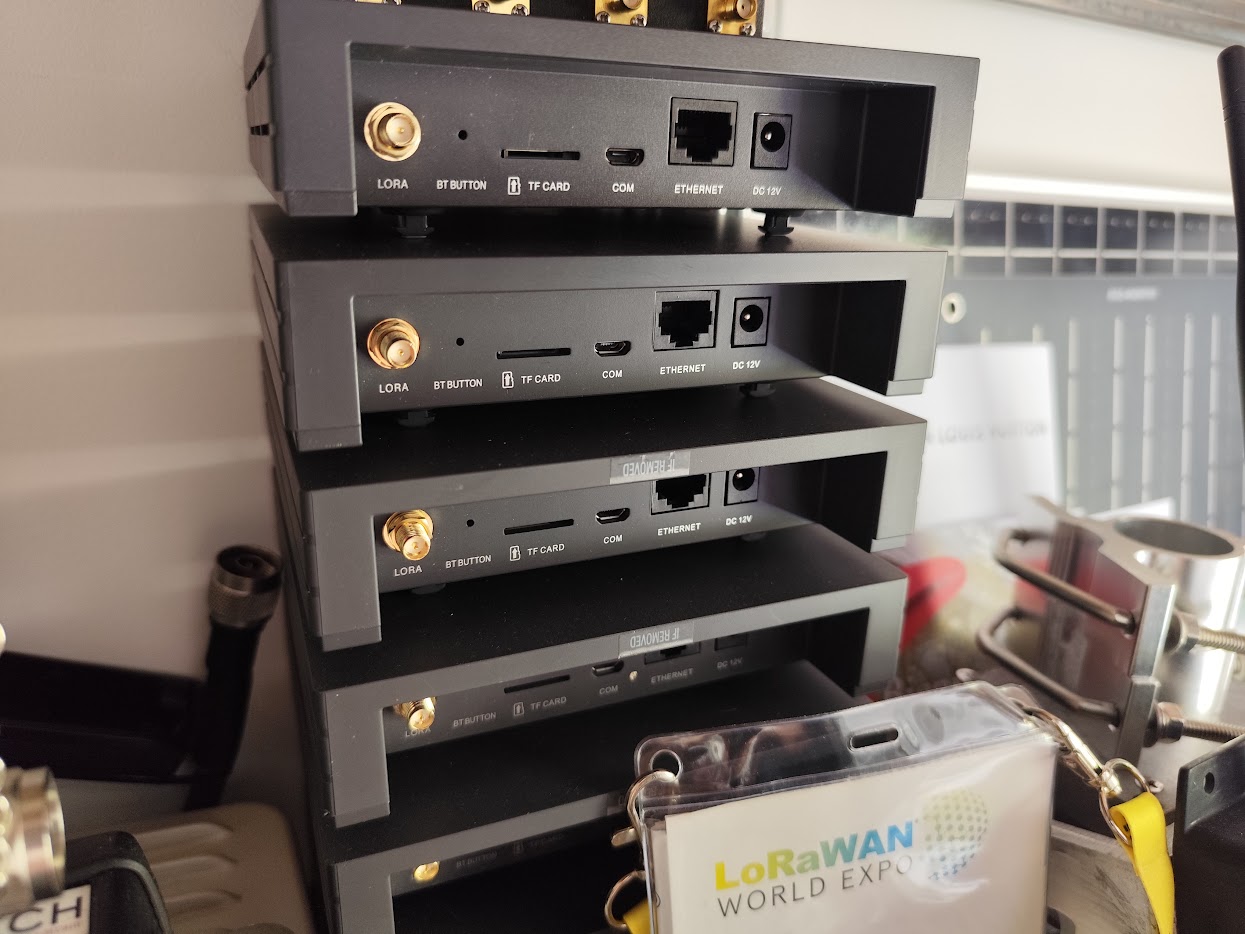
ChirpStack is a fully open-source LoRaWAN Network Server suite, built and maintained by Orne Brocaar since 2016. It implements the complete LoRaWAN specification: device join handling (OTAA and ABP), Class A/B/C support, adaptive data rate, multicast groups, firmware updates over the air (FUOTA), and multi-region frequency plan support.
It's not a hobby project or a proof-of-concept framework. ChirpStack runs production networks handling thousands of gateways and hundreds of thousands of devices worldwide. Telecom operators, system integrators, industrial companies, and municipalities use it as the foundation of commercial LoRaWAN deployments.
The architecture is clean and modern:
| Component | Role |
|---|---|
| ChirpStack Gateway Bridge | Converts gateway protocols (UDP/MQTT/BasicStation) to a common format |
| ChirpStack Network Server | Handles LoRaWAN MAC layer, device management, deduplication, ADR |
| ChirpStack Application Server | API, web UI, integrations, device profiles, payload codecs |
| PostgreSQL | Device registry, configuration, metadata |
| Redis | Session state, deduplication cache, device queues |
| MQTT Broker | Event stream for integrations (Mosquitto or similar) |
Everything runs on a single Linux server. A modest machine with 2 CPU cores and 4 GB RAM handles thousands of devices without breaking a sweat.
Why Running Your Own LNS Matters
No Per-Device Fees, Ever
Managed LoRaWAN platforms charge per device per month. The numbers look small at first, maybe EUR 0.50 or EUR 1 per device. But IoT deployments grow, and those fees compound:
| Devices | Managed LNS (EUR 1/device/month) | ChirpStack (self-hosted) |
|---|---|---|
| 100 | EUR 1,200/year | EUR 200/year (server) |
| 500 | EUR 6,000/year | EUR 200/year |
| 2,000 | EUR 24,000/year | EUR 300/year |
| 10,000 | EUR 120,000/year | EUR 500/year |
The self-hosted cost is the server. It doesn't change meaningfully whether you have 100 or 10,000 devices. The managed platform cost scales linearly with your fleet. At 500 devices, you save EUR 5,800 per year. Over five years, that's EUR 29,000, enough to fund the entire hardware deployment.
Your Data Stays on Your Infrastructure
With a managed platform, every sensor reading transits through someone else's servers. Every temperature measurement, water meter reading, GPS coordinate, and occupancy count passes through infrastructure you don't control, in a jurisdiction you may not have chosen, subject to data handling policies you didn't write.
With ChirpStack on your own server, the data path is entirely within your control:
Device -> Your gateway -> Your network server -> Your database -> Your dashboards
No third-party cloud. No data processing agreement to negotiate. No compliance risk from data crossing borders. For organizations in healthcare, government, critical infrastructure, or any sector with data sovereignty requirements, this isn't a nice-to-have. It's a hard requirement.
Full Control Over Configuration
Managed platforms give you a control panel with the options they've decided to expose. Need a custom ADR algorithm for your specific deployment scenario? Need to modify the join-accept delay for devices behind a satellite backhaul? Need to implement a custom integration protocol for a legacy SCADA system? On a managed platform: submit a feature request and wait. On ChirpStack: configure it.
The control that matters in practice is mundane and constant. Device profiles get tuned to your specific sensor types and transmission patterns rather than to a generic template. Payload codecs, written in JavaScript, turn your devices' binary payloads into structured data on the way through, so nothing downstream has to know about byte offsets. Integration endpoints push data straight into the systems you already run, over MQTT, HTTP, into InfluxDB or PostgreSQL, or through a protocol you write yourself. Multi-tenant configuration lets one server carry separate organizations, applications and access controls, which is what makes serving several clients or several sites from one instance practical. And the ADR parameters can be set for your actual radio environment instead of the defaults that ship for everyone's.
No Vendor Lock-In
A managed LoRaWAN platform is a dependency. If the vendor raises prices, changes terms, discontinues the service, or gets acquired, you have a problem. Your device provisioning data, payload codecs, integration configurations, and operational history are on their platform. Migration is painful, disruptive, and often expensive.
ChirpStack is open-source software running on your hardware. The code is on GitHub. The database is PostgreSQL on your server. If you need to migrate to different hardware, change hosting providers, or fork the codebase, you can. The project is licensed under MIT, one of the most permissive open-source licenses. No license audit surprises. No usage restrictions.
Integrations Without Middleware
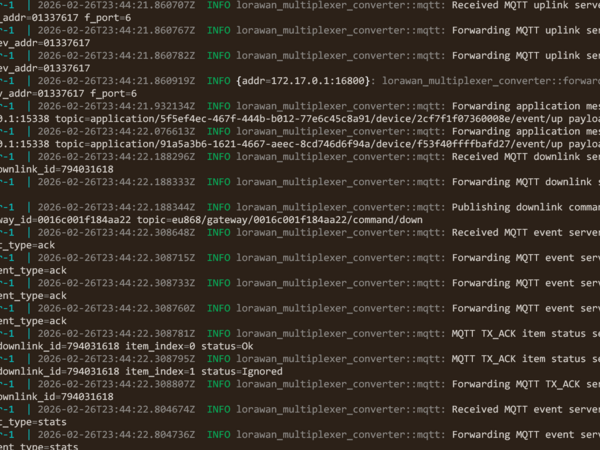
ChirpStack publishes device events to MQTT topics in a well-documented JSON format. Every uplink, join, status update, and acknowledgment is an MQTT message your systems can subscribe to directly.
That one design decision removes most of the middleware other platforms need. Time-series storage, whether InfluxDB or PostgreSQL with TimescaleDB, is a matter of subscribing to MQTT and writing rows. Grafana then reads from that database directly. Node-RED flows handle custom automation and alerting for teams who prefer wiring logic to writing it. Any language with an MQTT client library can consume the same stream, which is to say all of them. And bridging that stream into Azure IoT Hub or AWS IoT Core is how a cloud-native architecture gets its data without anything bespoke in between.
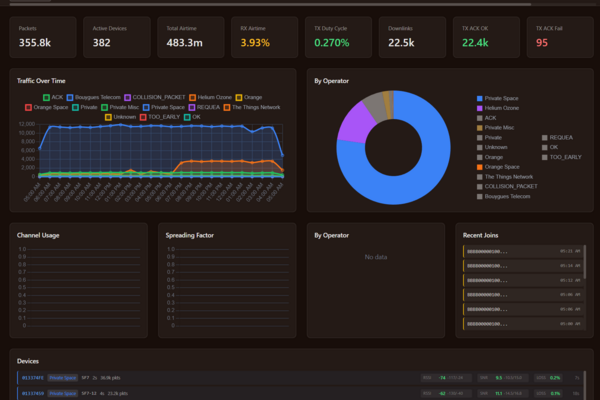
No API polling. No webhook reliability issues. No rate limiting. The data streams continuously from device to dashboard through a clean, real-time event pipeline. That same MQTT stream is what my open-source LoRaWAN traffic analyzer taps to visualize everything your gateways hear.
Common Objections, and Why They Don't Hold Up
"We don't have the expertise to run a server"
ChirpStack installs on a Debian or Ubuntu server with a handful of commands. The documentation is thorough. The configuration is straightforward TOML files. If your organization can maintain a web server, a database, or any Linux-based application, you can run ChirpStack.
And if you genuinely don't have that expertise in-house, that's exactly what I provide. I deploy, configure, and hand over a fully operational ChirpStack instance with documentation and training. A one-time engagement, not a recurring subscription.
"What about updates and security patches?"
ChirpStack releases are well-documented with clear upgrade paths. The project follows semantic versioning. Security updates for the underlying OS come from your standard Linux distribution's package manager, the same process you follow for any server.
Automated monitoring catches issues before they become problems. Set up a simple health check on the ChirpStack API endpoint, configure Grafana alerts on device join failures or gateway connectivity drops, and the system tells you when something needs attention.
"Managed platforms have better uptime"
A properly configured Linux server with ChirpStack achieves 99.9%+ uptime routinely. The application is lightweight and stable. The most common cause of downtime isn't software failure. It's the underlying infrastructure (power, network, hosting provider), which affects managed platforms equally.
For high-availability requirements, ChirpStack supports clustering with load-balanced instances, Redis Sentinel for state management failover, and PostgreSQL replication for database redundancy. The same patterns used for any production web application.
"We need support"
The ChirpStack community is active and responsive. The project maintainer and community members answer questions on the forum and GitHub issues. For organizations that need guaranteed response times, commercial support options exist.
More importantly, because ChirpStack is built on standard, well-understood technologies (PostgreSQL, Redis, MQTT, Go), any competent systems administrator can troubleshoot and maintain it. You're not dependent on a specialized support team that understands a proprietary platform's internals.
What a ChirpStack Deployment Looks Like
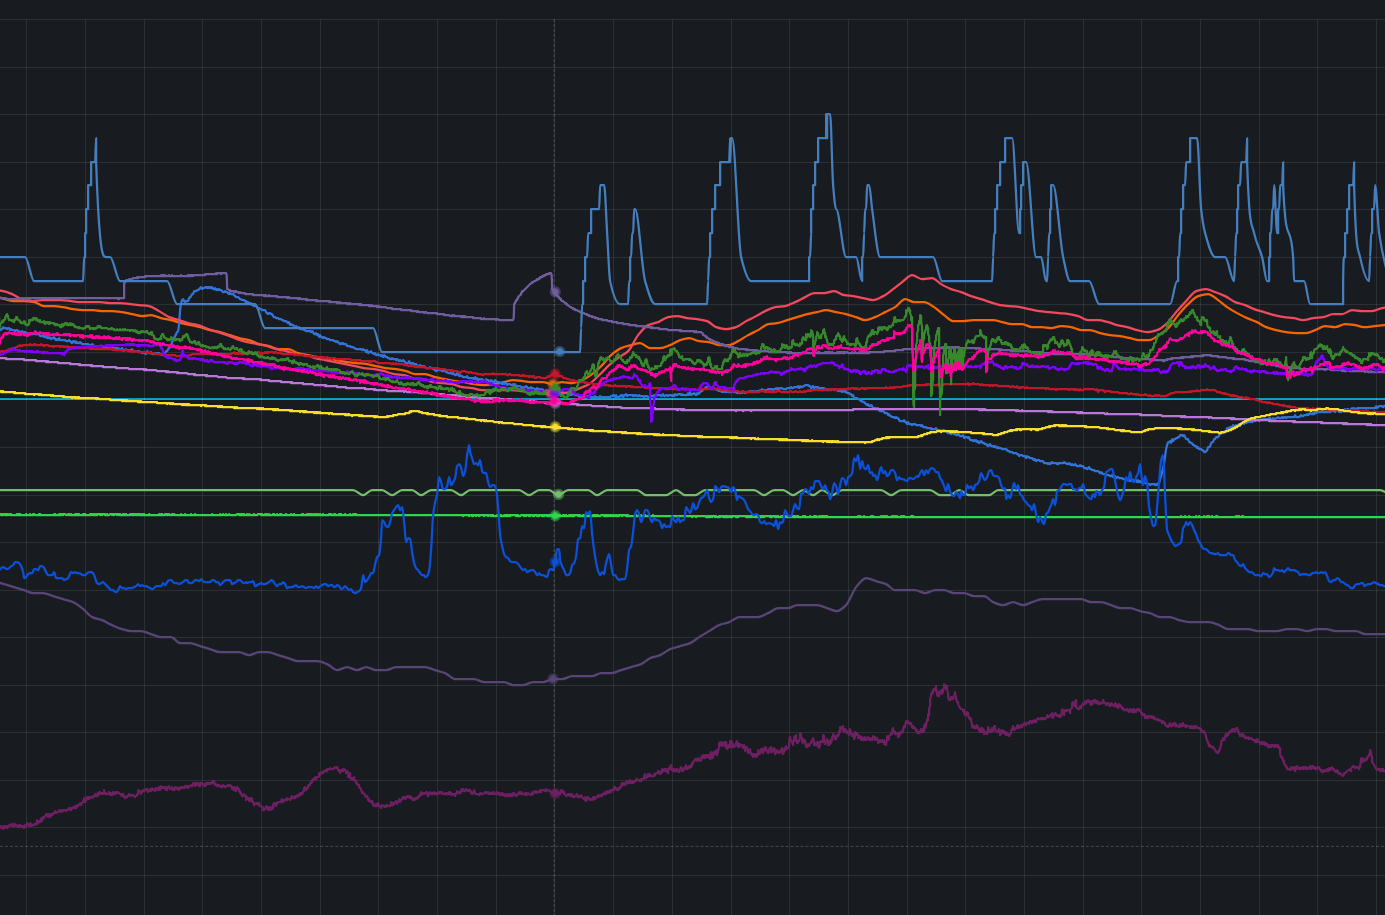
A typical production deployment runs on a single Linux VM, Debian or Ubuntu, either at a cloud provider or on hardware in your own building.
On it sit ChirpStack itself, covering network server, application server and gateway bridge; PostgreSQL for the device registry and configuration; Redis for session cache and deduplication; Mosquitto as the MQTT broker that integrations subscribe to; a time-series database for the measurements; Grafana for dashboards and alerting; and Nginx in front doing reverse proxy and TLS termination, with Let's Encrypt issuing the certificates automatically.
Securing it is the ordinary work of running any internet-facing service. TLS on every external connection, firewall rules that open only the ports actually in use, automated OS security updates, database backups on a schedule, and MQTT authentication for every integration client rather than an open broker.
Monitoring watches five things: gateway connectivity and packet statistics, device join success rates and uplink frequency, server CPU, memory and disk, database size and query performance, and alerting out of Grafana to email, Slack or a webhook. That set catches essentially everything that goes wrong in practice, and it catches it before a user notices.
The entire stack deploys in a day. Device onboarding, payload codec configuration, and dashboard creation follow. Within a week, you have a production-ready private LoRaWAN network with real-time dashboards showing your sensor data. The demo dashboard is the far end of that stack, open without a login, if you want to see what a week of this work produces.
When a Managed Platform Still Makes Sense
Transparency matters more than sales, and there are four situations where I would tell you to use a managed platform.
A proof of concept with fewer than twenty devices is one, because speed of deployment genuinely outweighs long-term cost at that size. Temporary deployments are another: something running for weeks or months rather than years never reaches the point where the arithmetic turns. An organization with no technical capability and no budget for the initial consulting is a third, since a server nobody can maintain is worse than a subscription. And roaming requirements are the fourth, where you need interoperability with public LoRaWAN networks run by telecom carriers and there is no self-hosted equivalent.
For anything beyond a small pilot, the economics and control advantages of self-hosted ChirpStack are overwhelming. The breakeven point is typically around 30-50 devices. Beyond that, you're paying for someone else's infrastructure when you could own your own.
What I Provide
I deploy and configure complete ChirpStack-based infrastructure: the server stack (ChirpStack, PostgreSQL, Redis, MQTT, InfluxDB, Grafana) fully configured, secured, and monitored; your gateways registered, frequency plans set, and packet forwarding verified; devices provisioned with correct profiles and payload codecs written and tested, with data flowing to dashboards. The Grafana dashboards are built for your use case, real-time monitoring, historical analysis, and alerting, and data pipelines connect into your existing systems over MQTT, HTTP, or direct database connections. Your team gets the documentation and training to operate and extend the system independently, and support afterwards is available when you need it, not as a mandatory subscription.
One-time consulting engagement. No recurring platform fees. No per-device charges. You own the infrastructure, the configuration, the dashboards, and the data. Completely.
Working on a LoRaWAN project?
If this article touches on something you're building, tell me about it. The first conversation is free, and you'll get an honest read on the right approach for your situation.
Book a Free ConsultationCurious what the finished thing looks like? Open the live demo dashboard