LoRaWAN Electricity Sub-Metering Systems
What is Electricity Sub-Metering
You have one main meter from the utility. It tells you total building consumption. But which tenant used what? Which EV charging station drew how much power? Is your solar installation actually producing what the salesman promised?
You don't know. That's the problem sub-metering solves.
Sub-meters measure consumption at the unit, circuit, or equipment level: individual apartments, EV chargers, solar inverters. You know exactly what's happening: who's using what, what's wasting energy, what's underperforming.
Without sub-meters, you split bills equally (unfair to light users) or estimate (which causes disputes). With sub-meters, you bill on actual consumption and find energy waste you didn't know existed.
Why LoRaWAN for Electricity Monitoring
Wired sub-metering means running RS-485 or Ethernet from every meter back to a collection system, threading data cable through electrical panels and across a building. LoRaWAN removes that entirely. Operating at 868 MHz (EU) or 915 MHz (US), its signals penetrate concrete walls and metal enclosures, so you install meters wherever you need them without a single data cable.
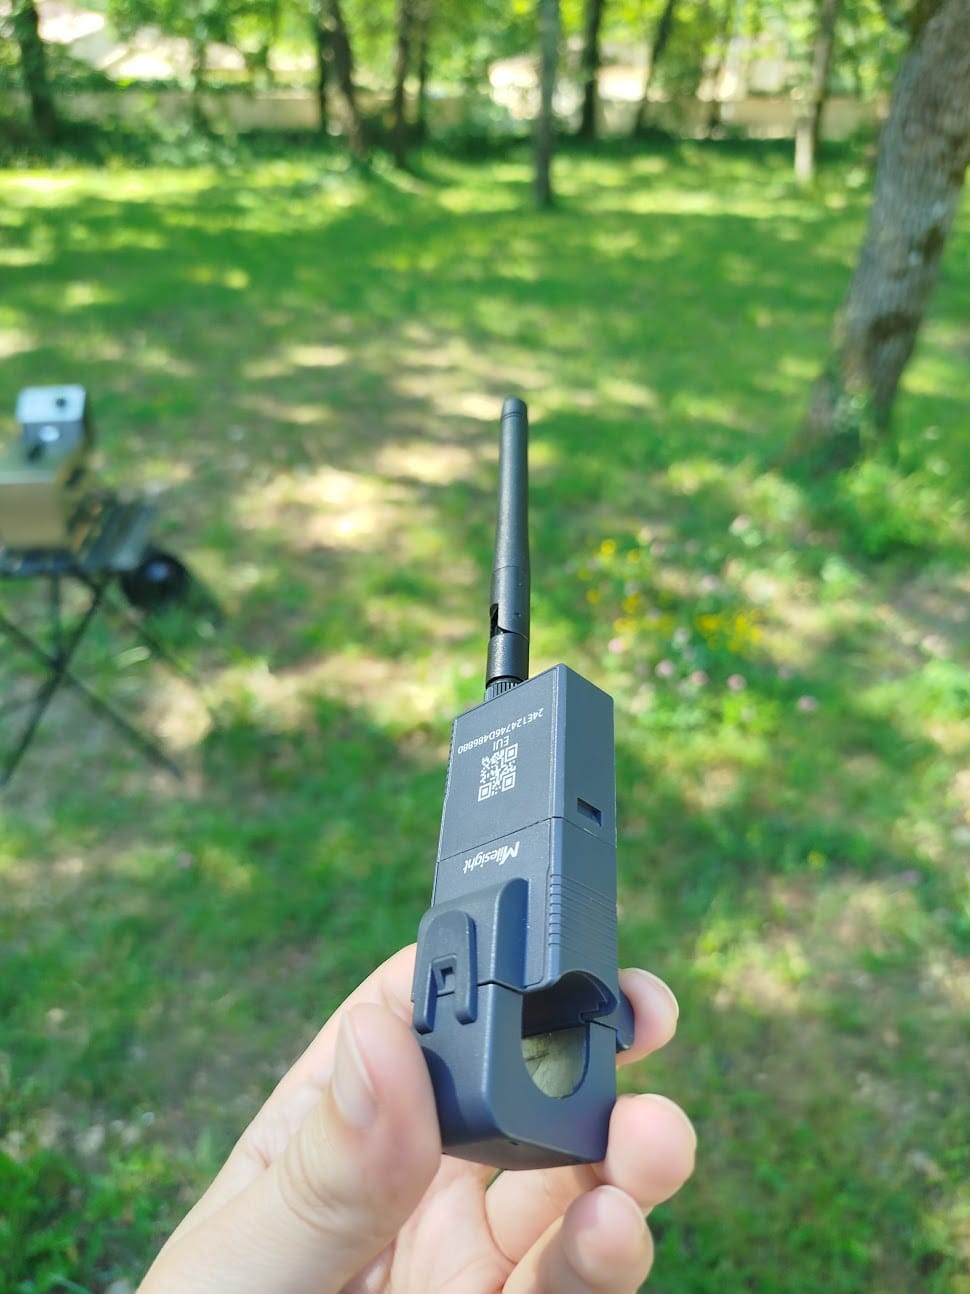
The rest follows from that. Many CT clamps harvest their own power from the current they measure, using a supercapacitor charged by the conductor itself (the Milesight CT101 works this way), so there's nothing to power and nothing to replace; other models run several years on a battery. One gateway covers an entire building complex, solar farm, or RV park, and hundreds of meters share it, so adding a meter means provisioning a device, not extending infrastructure. And because CT clamps clip around an existing conductor, a licensed electrician installs one in seconds without breaking the circuit or interrupting service.
Hardware Options
CT Clamp Sensors
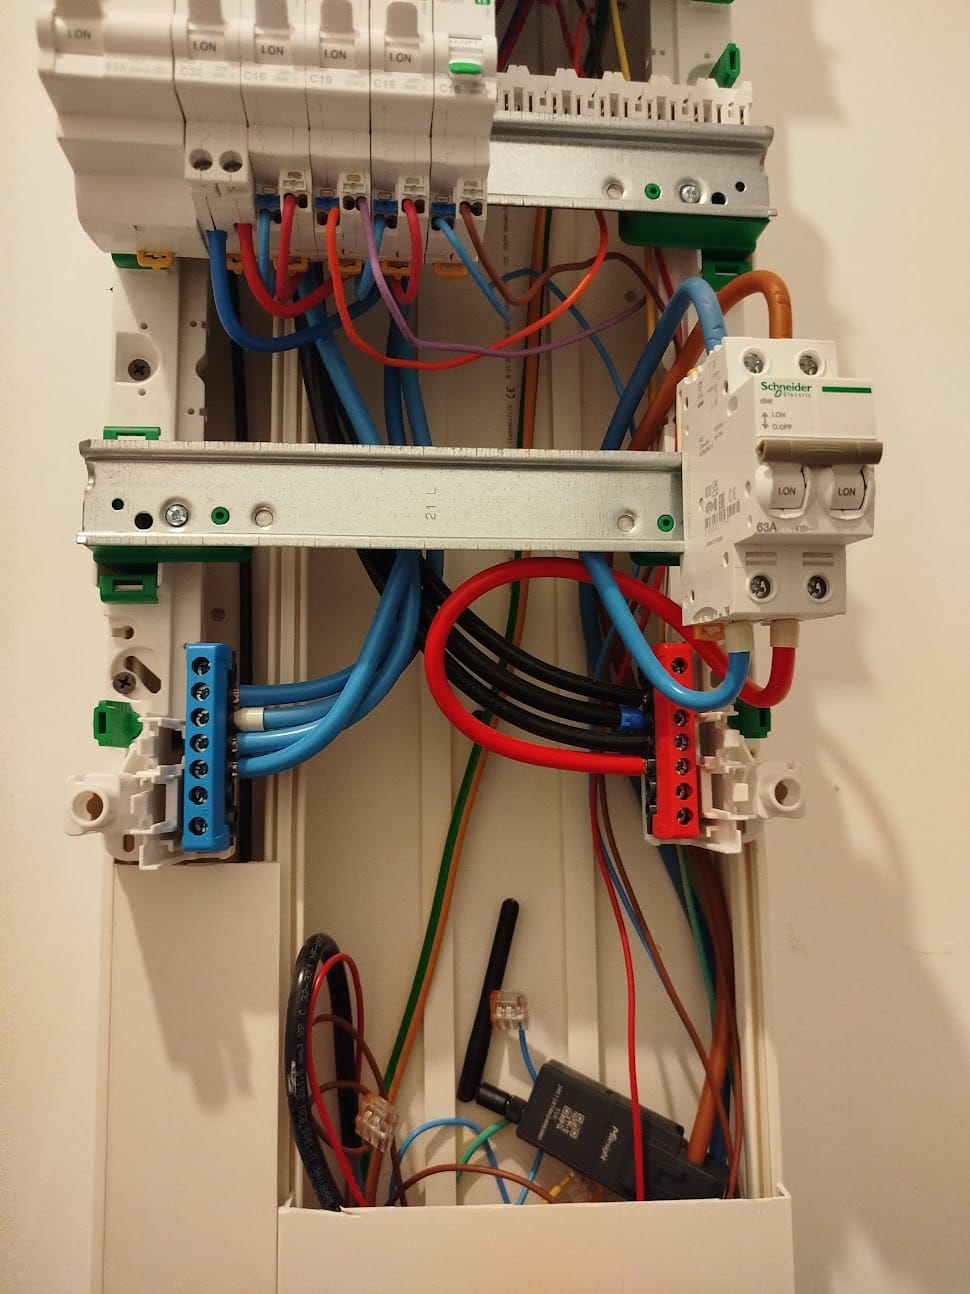
Self-powered CT clamps (Milesight CT101 and similar) harvest power from the measured current into a supercapacitor, so they need no battery ever and clamp onto an L1, L2, or L3 conductor in seconds without breaking the circuit. Variants typically measure up to 100 A or 300 A, with accuracy that's fine for billing and monitoring.
There is one hard limitation you must design around:
Self-powered CT clamps require at least 400 W of continuous draw through the measured conductor to keep the supercapacitor charged and sustain a 1-minute uplink. Below 400 W the supercapacitor can't charge and the device stops transmitting. This is measured real-world behavior, not a theoretical spec.
That rules self-powered mode out for anything that isn't a heavy, always-on load:
- Low-power circuits (lighting, small appliances, individual outlets)
- Intermittent loads (EV chargers between sessions, duty-cycled equipment)
- Circuits that switch off overnight or on weekends
- Individual apartment circuits (typically 200-1000 W peak, not continuous)
The CT101 has an escape hatch: power it from USB-C 5 V instead of harvesting, and the minimum-current requirement disappears entirely, letting you monitor any circuit regardless of load. That's useful for temporary monitoring, low-power circuits, or anywhere you need guaranteed operation, at the cost of running a USB cable to the install location. For permanent installs on sub-400 W circuits where USB isn't practical, use a battery-powered clamp instead. Self-powered mode belongs on the circuits it's built for: main building feeds pulling kilowatts continuously, industrial equipment that never stops, central HVAC, data-center power distribution.
Battery-powered CT clamps trade maintenance for precision, running several years on a replaceable cell (life depends on transmission frequency) and sometimes reading more accurately than self-powered variants. The Adeunis ARF8180AA and Elsys EMS are common choices.
For three-phase systems, install one clamp per phase to measure each individually, calculate total power, and detect phase imbalance and power factor.
DIN Rail Energy Meters
These mount on standard DIN rails inside a distribution board and measure both voltage and current directly, so they compute true power in watts and read more accurately than a CT clamp. Because the circuit must be de-energized to install one, they need a licensed electrician and planned downtime, which makes them a poor retrofit but an excellent choice for new construction, panel upgrades, or anywhere accuracy matters legally. Revenue-grade models offer the highest precision, and features run to cumulative kWh, power factor, and total harmonic distortion (THD). For connectivity you either pair a Modbus meter with a LoRaWAN gateway or pick a model with native LoRaWAN.
Smart Plugs with LoRaWAN
For individual appliance monitoring without touching a panel, a LoRaWAN smart plug sits between the outlet and the device. It handles moderate plug-in loads, not hardwired or high-power equipment like HVAC or industrial machinery, and suits tracking a specific appliance, a temporary energy audit, or any situation where panel access isn't feasible.
Applications
Solar Production Monitoring
Sub-metering the inverter output separately from building consumption lets you watch generation against consumption in real time: solar produced in kWh, building used in kWh, grid import/export for net metering, and self-consumption percentage calculated automatically. That turns solar ROI from a projection into a measured number, and it tells you when to act, running the washing machine, charging the EV, or heating water while the panels produce surplus, and when to charge battery storage or defer a high-power load based on the generation forecast.
EV Charging Stations
Give each charging point its own sub-meter and you bill on actual kWh delivered rather than a flat rate. A CT clamp on each charger circuit monitors current draw, calculates energy delivered, and feeds a billing system or RFID card reader. The same live data drives load balancing: watch total facility power against your grid connection limit and throttle chargers dynamically to stay under it, prioritizing by user tier or vehicle state of charge.
RV and Camper Hookups
Campgrounds can meter each pedestal instead of charging a flat daily rate. Sites run 15 A, 30 A, or 50 A service, a CT clamp on each site feed reports live usage, and a dashboard warns as a site approaches its amperage limit. At checkout, the kWh consumed during the stay generates the invoice, and usage patterns (an AC unit running all night, say) can justify dynamic pricing.
Multi-Tenant Buildings
Metering individual apartments or commercial units enables fair billing on real consumption. Buildings with central HVAC but per-unit appliances gain by separating common-area from unit usage, and mixed commercial tenants, offices, retail, restaurants, have wildly different profiles that only individual metering allocates fairly; the same is true for industrial tenants sharing a building, where accurate measurement is what prevents disputes. Retrofits typically use CT clamps on each unit's main feed, while new construction or a panel upgrade can take DIN rail meters for higher accuracy, and automated monthly billing removes the manual meter-reading and invoicing entirely.
Industrial Equipment Monitoring
Metering per machine, line, or process turns energy data into operational insight. Rising current draw signals a bearing or motor degrading before it fails catastrophically, so it feeds preventive maintenance. Efficiency audits find equipment drawing more than it should, justifying repair or replacement. Cost allocation attributes energy to specific products or batches for accurate accounting. And load-shedding programs drop non-critical equipment during demand-response events to cut the peak-demand charges that can be a large slice of an industrial bill. For older machinery, this pairs naturally with retrofitting legacy equipment rather than replacing it.
Data Pipeline
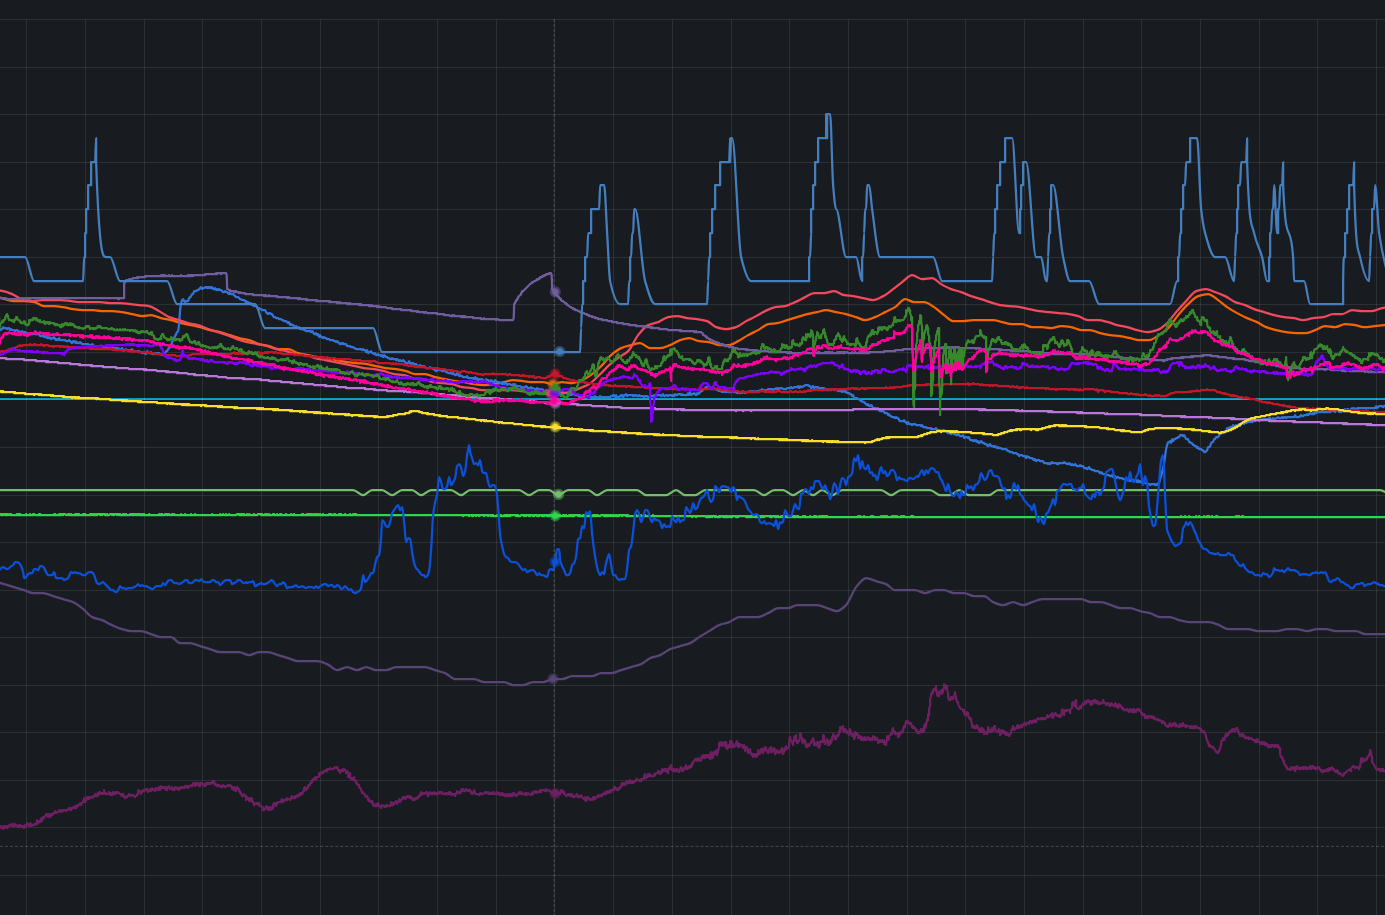
The gateway receives meter transmissions and forwards them to a network server (ChirpStack, The Things Network, or a commercial alternative), which decodes the packets and pushes the readings into InfluxDB or a similar time-series database; Grafana or a custom dashboard then queries that database for visualization and alerting.
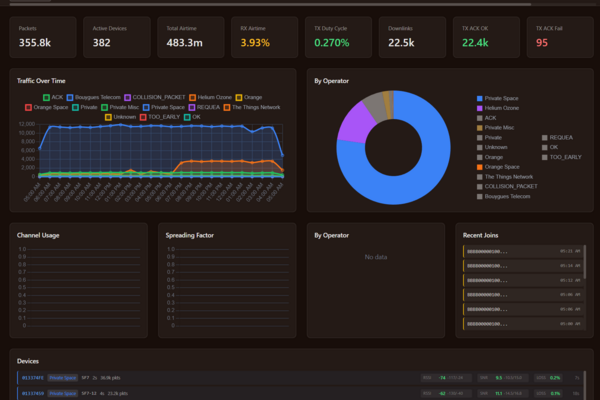
What gets stored is instantaneous power in watts, cumulative energy in kWh, voltage, current in amps, power factor on three-phase installs, and frequency, the raw material for every calculation, chart, and invoice, with history that reveals consumption patterns across days, weeks, and months. On top of it, real-time load graphs show current draw at a glance, daily/weekly/monthly kWh totals summarize billing periods, cost tracking against your rate structure (including time-of-use pricing) turns energy into money, load-profile heatmaps show when consumption happens, and comparison across units flags the outliers using far more or less than their peers. Several of those meters are reporting on the demo dashboard, instantaneous watts next to the cumulative kWh counter, which is the pairing every billing calculation rests on.
Alerts close the loop. Configure them to fire when usage exceeds contracted capacity (so you can shed load before utility penalties hit), when voltage strays outside its normal range (a grid or equipment problem), when three-phase current imbalance crosses a threshold (a wiring fault or uneven load), when power factor drops below an acceptable level (inefficiency that may carry penalties), or when equipment reads zero current while it should be running (a failure needing immediate attention).
System Design Considerations
Gateway placement. Put it centrally with sight lines to the panels and meters. Electrical rooms often work, but metal enclosures shield RF, so test coverage before you commit, and plan for multiple gateways or external antennas in large or steel-framed buildings.
CT clamp sizing. Match the clamp's range to the expected current. A 100 A CT on a 200 A circuit won't work: undersized clamps saturate and read false, oversized ones lose low-end accuracy. Rule of thumb, size for 150% of maximum expected current.
Voltage reference. A CT clamp measures current only, and power needs voltage (W = V × A). You either assume a fixed 230 V (typically 3-5% error), add a voltage-reference sensor in the panel for better accuracy, or use a DIN rail meter that measures both directly.
Transmission frequency. On battery models this trades freshness against life: ten-minute intervals suit real-time monitoring, thirty minutes is a good all-round compromise, and hourly is plenty for billing while maximizing battery life. Actual life depends on temperature, transmit power, and hardware, so check the manufacturer's figures. Self-powered models transmit based on current flow with no battery to consider, but remember they need continuous power above 400 W to function at all.
Network server choice. Self-hosted ChirpStack gives full control and no per-device fees but needs a sysadmin; The Things Network is free with fair-use limits and good for small deployments; commercial providers offer a managed service and SLAs at higher cost.
Billing Integration
For small deployments (under ~20 units), export monthly consumption as CSV and import it into billing software or invoice manually. A semi-automated setup generates the monthly report on a schedule and has staff review it for anomalies, zero consumption means a meter is offline, 10× normal suggests a wiring error, before invoicing. Fully automated, an API links the metering database to the billing system for invoice generation against rate tables, time-of-use pricing, demand charges (based on the peak 15-minute interval), exception handling for unusual patterns, and integration with property-management software.
Common Implementation Mistakes
CT clamp orientation. Clamps have polarity; installed backwards, they report negative power (generation instead of consumption). Mark conductor direction before you install.
Measuring neutral instead of phase. The clamp must go around a phase conductor (L1, L2, L3), not neutral or ground. Neutral current only reflects imbalance on three-phase systems.
Metal enclosure shielding. LoRaWAN attenuates badly through a metal panel enclosure. Test coverage with the door closed before finalizing, and expect to need an external antenna or a gateway near the panels.
No calibration verification. Clamps ship factory-calibrated, but transport damage happens. Verify against a known load before deployment, because a ±3% spec can drift to ±10% if the unit was knocked about.
Single-phase monitoring of three-phase loads. One clamp on a three-phase load reads a third of the total at best. Put a clamp on each phase and sum them: total power = P1 + P2 + P3.
What I Provide
I design sub-metering systems end to end. That starts with the electrical side: analyzing your panels, sizing the CTs, and deciding where meters and gateways go so the RF actually works. Then the software: network server setup (ChirpStack, if you're self-hosting), a data pipeline into InfluxDB with Grafana or a custom dashboard on top, the power calculations (real power, reactive power, power factor), alert rules, and billing integration with rate tables, time-of-use pricing, and demand charges. For EV charging and demand-response projects, the load-balancing logic is part of the build.
You own the result: the source code for processing and dashboards, the infrastructure (self-hosted or cloud, your choice), the documentation, and the provisioning procedures, with no monthly platform fees. I don't sell hardware. I specify what you need, whether that's Milesight, Adeunis, or Elsys clamps, DIN rail meters, or gateways, help you source it, and build the software that makes it work for your application.
Working on a LoRaWAN project?
If this article touches on something you're building, tell me about it. The first conversation is free, and you'll get an honest read on the right approach for your situation.
Book a Free ConsultationCurious what the finished thing looks like? Open the live demo dashboard