LoRaWAN Range Testing and Coverage Planning
Why Range Testing Determines Deployment Success
You're about to commit to gateway locations, maybe one site, maybe dozens across a portfolio. Every one of those locations means mounting hardware, running power and backhaul, and possibly arranging roof access or mast work. Get the placement right and the network just works. Get it wrong and the fix isn't a software patch; it's sending a team back on-site to relocate gateways and re-survey, after you've already deployed sensors that can't connect.
This is one of the decisions that's cheap to get right and expensive to get wrong. Too few gateways and devices can't connect reliably: packet loss climbs, battery life suffers, and you're troubleshooting connectivity instead of collecting data. Too many gateways and you've wasted budget on redundant infrastructure. A few days of range testing up front is a fraction of the cost of either mistake.
Range testing reveals actual coverage before you commit. You find the dead zones, map the boundaries, and place gateways based on measured performance rather than manufacturer claims.
Factors That Determine Actual Range
The single biggest factor is the environment. Urban areas typically deliver 2-5 km as buildings block and reflect signals, suburban settings with less obstruction reach 5-10 km, and rural deployments with clear line-of-sight can hit 10-20 km. Indoors it collapses to 100-500 m, because concrete and metal attenuate the signal heavily.
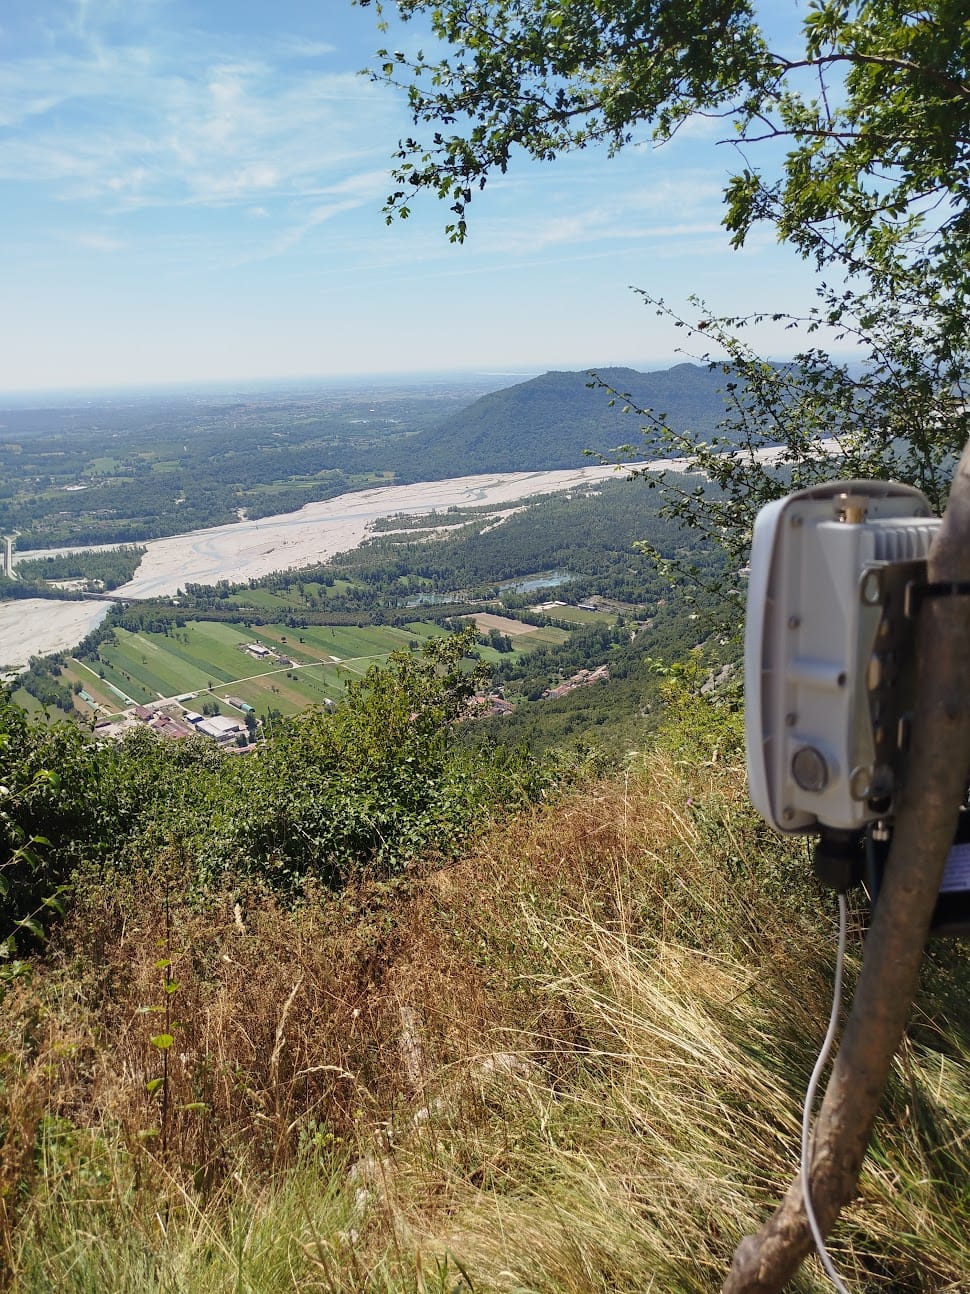
Close behind is gateway elevation, and it matters more than most people expect. Moving a gateway from ground floor to rooftop makes a 2-3× difference in coverage radius, not because the radio improves, but because you've cleared the Fresnel zone, the first 60% of the line-of-sight path that needs to stay free of obstacles. Elevation buys that clearance over the buildings, trees, and terrain that would otherwise block the signal.
The remaining factors are smaller dials. Most devices transmit at 14 dBm (25 mW); some support 20 dBm (100 mW) for a little more range, but the battery cost rarely justifies it, so 14 dBm is the norm. Spreading factor trades speed for reach: SF7 is fast (5-10 kbps), shorter range, and battery-light, while SF12 is slow (250 bps), long range, and battery-heavy, and Adaptive Data Rate (ADR) picks the best one automatically, SF7 near a gateway, SF12 at the edge. Finally, antenna gain helps at the margins: stepping a gateway from a 3 dBi omni to a 6-8 dBi omni improves range 30-50% (12-15 dBi directionals cover a specific sector instead), and on the device side, swapping a 0-2 dBi PCB antenna for a 3-5 dBi external whip adds roughly 500 m-1 km, worthwhile for edge devices.
Practical Range Testing Methodology
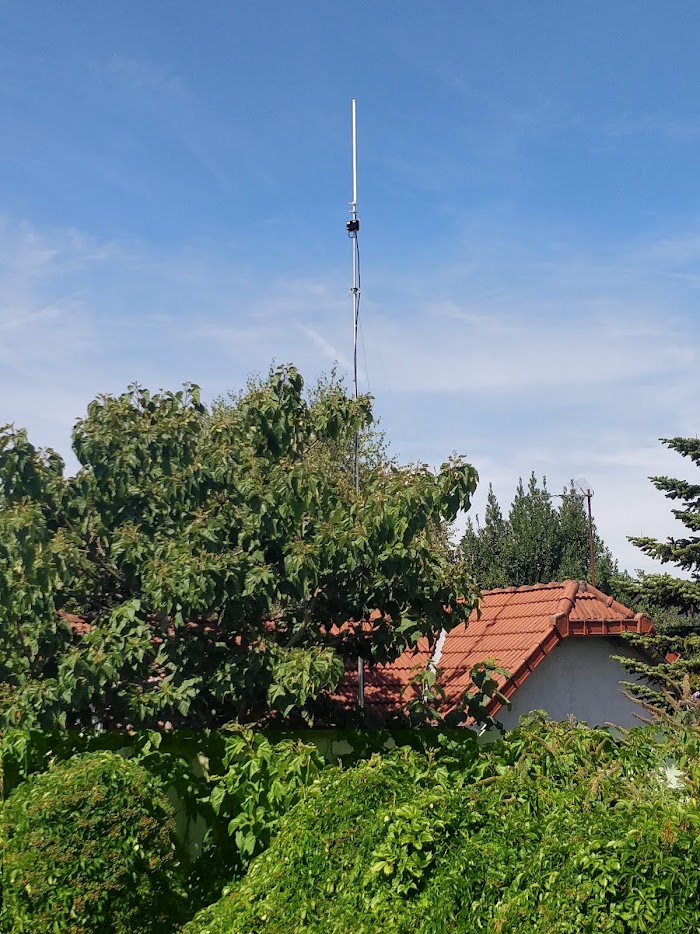
The kit is modest: a test device configured to transmit every 30 to 60 seconds, a GPS tracker or smartphone logging location, a network server showing packet reception in real time, and either a vehicle or a planned walking route that covers the area where devices will actually go.
The procedure is equally plain. Install the gateway at your proposed location. Drive or walk outward from the gateway in multiple directions, covering all areas where devices will actually be deployed. Log GPS coordinates where packets stop being received reliably. Mark these boundaries on a map to visualize coverage extent. Identify dead zones (no coverage) and weak coverage areas (high packet loss or poor signal quality).
This process reveals actual coverage rather than theoretical calculations. A 10-minute desktop RF propagation analysis might predict 5km coverage, but your range test shows 2.5km in one direction due to a hill you didn't account for, and 7km in another direction where terrain provides better propagation. This information determines whether you need one gateway or three.
Three metrics tell you what you're looking at. RSSI (received signal strength) measures signal power in dBm, where -120 dBm is the practical communication limit and -100 dBm is a good signal; where you fall between those two decides whether a device runs on SF7 (fast, efficient) or SF12 (slow, battery-intensive). SNR (signal-to-noise ratio) measures quality against background noise, and one of LoRaWAN's defining advantages is that it still works at negative SNR on SF12, though positive SNR is better because it enables lower spreading factors and longer battery life. Packet loss rate ties it together: under 5% is acceptable coverage, while over 20% means real operational problems, devices draining batteries on retries and data going missing.
Coverage Planning Tools
Propagation software comes first, before anyone climbs anything. Tools like Radio Mobile and CloudRF predict coverage based on terrain data and gateway parameters. These desktop planning tools are useful for initial gateway placement before physical installation. They won't match real-world performance exactly, but they help you avoid obviously poor gateway locations and identify promising sites for testing.
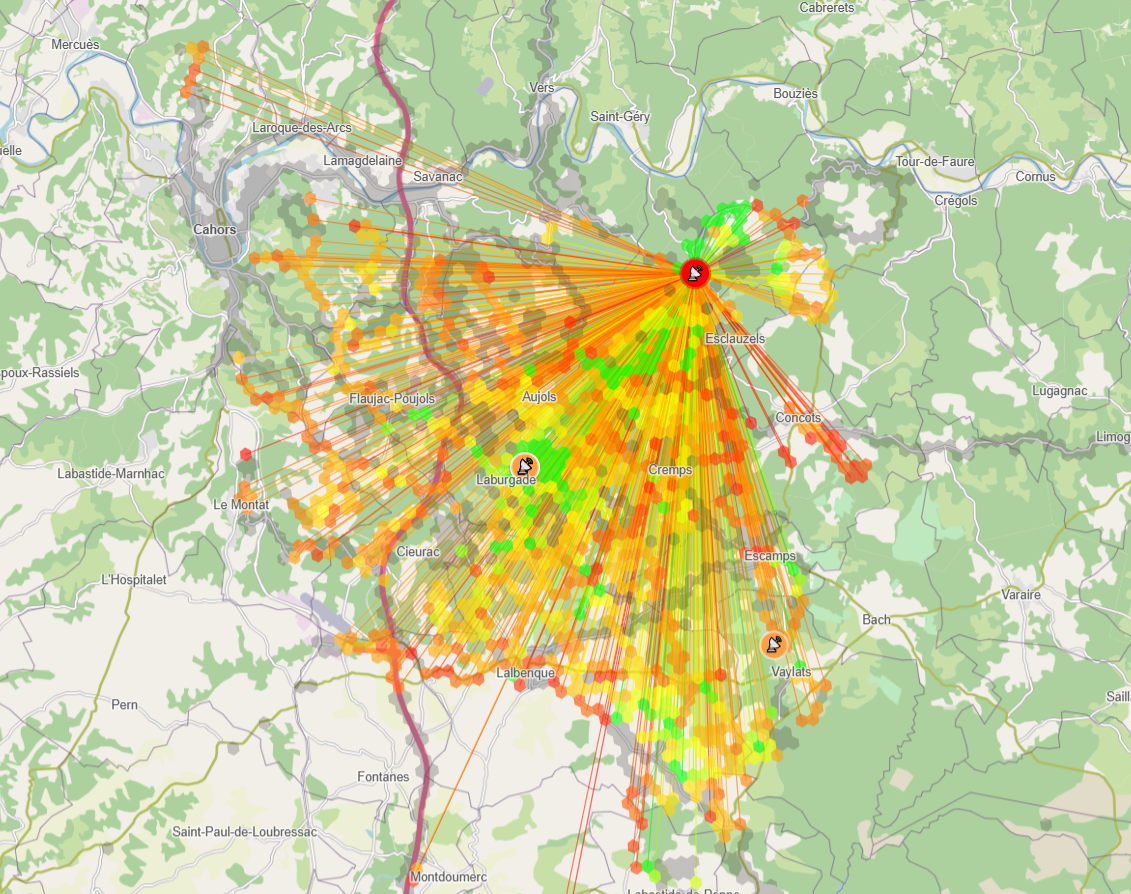
A mapper is the tool that replaces prediction with measurement. It is a small GPS-equipped LoRaWAN device you carry while walking or driving through the deployment area. It transmits at regular intervals and logs the GPS position, RSSI, SNR, and spreading factor for every packet received by your gateways. After the survey, you overlay the results on a map: green dots where coverage is strong, yellow where it's marginal, red where packets are lost. This gives you a real, measured coverage map instead of theoretical predictions. Mapper devices are the single most reliable way to validate gateway placement before committing to a full sensor rollout.
I provide a custom-built coverage assessment platform that ingests mapper data and generates detailed geographic coverage heatmaps. Plot RSSI, SNR, and packet loss across your deployment area. Identify dead zones, compare gateway placement scenarios, and share interactive maps with your team. This goes beyond basic mapper logging; it's a proper planning tool that turns raw walk-test data into actionable deployment decisions.
Before doing any of that, it is worth checking whether somebody already has. The Things Network's crowdsourced coverage mapping tool shows real-world range data contributed by the community. If you're deploying in an area with existing TTN coverage, TTN Mapper shows actual measured performance from similar deployments. This provides realistic range expectations for your area rather than theoretical calculations.
As for measurement gear, professional field strength meters cost 1000+ EUR but provide highly accurate measurements. For most LoRaWAN deployments, inexpensive LoRa test devices (50 EUR) work fine for relative measurements, since you're comparing signal strength at different locations rather than requiring laboratory-grade absolute accuracy.
Interpreting Coverage Test Results
Read the map in three bands. A strong signal (RSSI above -100 dBm, SNR above 5 dB) is your ideal zone: devices run on SF7, so airtime and battery drain are low and they can transmit frequently without congestion. A moderate signal (RSSI -100 to -120 dBm, SNR 0 to 5 dB) is acceptable, with devices on SF9-SF11 and reliable communication at the cost of some battery efficiency traded for range; this works for most applications. A weak signal (RSSI below -120 dBm, SNR below 0 dB) is the edge of coverage: devices get stuck on SF12, meaning slow 250 bps transmission, heavy battery drain, and likely packet loss, and anything deployed here will suffer shortened battery life, missed transmissions, and unreliable connectivity. Those zones need an additional gateway or a relocation.
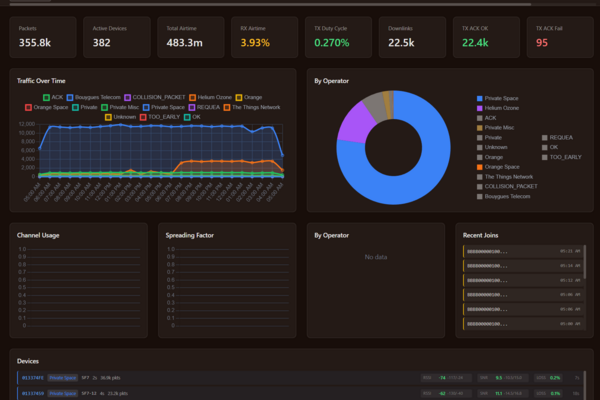
The same three numbers are worth watching long after the survey. The demo dashboard tracks RSSI, SNR, and spreading factor per device on a dedicated page, which is where a coverage problem shows up first once the devices are permanently installed and the seasons start changing what the path looks like.
Coverage Planning Best Practices
Prioritize elevation over antenna gain. A gateway at 10 meters on standard equipment beats one at 3 meters with a high-gain antenna, because elevation provides Fresnel zone clearance that gain can't compensate for. Get height first, then optimize the antenna.
Plan for overlap. Having multiple gateways hear the same device adds redundancy and lifts reception rates, so aim for 20-30% overlap between coverage areas to avoid single points of failure.
Test at real device height. Don't survey holding the device at head height (1.8 m) if you'll deploy soil sensors at 0.3 m; the difference changes propagation and gives you optimistically wrong predictions. Test where the devices will actually sit.
Account for time of day. Atmospheric conditions shift through the day, and a night-time temperature inversion can extend range unexpectedly, so test during the hours your devices will actually transmit rather than at midnight for daytime sensors.
Factor in building materials. Attenuation varies sharply: concrete and brick cost 10-15 dB per wall, metal 20-30 dB (nearly killing the signal), wood 5-8 dB, and glass only 2-3 dB. One gateway might cover a whole office of glass partitions yet fail to punch through two concrete walls, so plan indoor coverage accordingly.
Common Coverage Testing Mistakes
Trusting theoretical range claims. A "15 km range" figure assumes clear line-of-sight, no obstacles, and perfect atmospherics. Reality is messier, buildings, trees, terrain, and interference all cut it down, so a gateway might reach 15 km across flat farmland in one direction and 2 km toward a city centre in another. Test actual conditions, not the maximum on the box.
Testing only with SF7. Edge devices use SF12 to hold a link, so an SF7-only survey shows excellent coverage everywhere you walked while deployed devices at those same spots can't connect, because they need SF12 and you never validated it. Always test with the spreading factor the devices will actually use.
Single-pass testing. One drive-by doesn't tell the whole story, since propagation shifts with weather, time of day, and foliage (summer versus winter is a big difference). Coverage that looks fine in winter can vanish when the trees leaf out, so test under multiple conditions before trusting the map.
Ignoring gateway capacity. One gateway can theoretically serve thousands of devices, but congestion appears in practice around 500-1000 actively transmitting per gateway. A dense deployment needs extra gateways for capacity even where range looks fine, a single gateway over a university campus might show strong signal everywhere yet choke on 2000 devices all reporting hourly. The math behind that ceiling is covered in the duty cycle and airtime article.
What I Provide
Coverage is the foundation everything else sits on, and much of getting it right is experience: knowing where to place a gateway, how to read a marginal SNR value, and when a clean-looking test pass is hiding a problem that summer foliage or a temperature inversion will expose later.
I run coverage surveys and walk tests that produce measured maps rather than theoretical propagation estimates, work out where gateways should go and how many you actually need, and use my own coverage-mapping platform to turn walk-test data into RSSI, SNR, and packet-loss heatmaps you can base decisions on. I also troubleshoot existing networks with packet loss or dead zones, and when a project calls for it, deliver the full stack: firmware, network server, dashboards, and integration. Everything delivered comes with source code and documentation, the survey data and maps are yours, and there are no recurring fees.
If a full deployment is still ahead of you, a one-off coverage study, a site survey plus a measured map of your proposed gateway locations, tells you exactly how many gateways you need before you buy any.
Talk to an expert about your coverage study.
Working on a LoRaWAN project?
If this article touches on something you're building, tell me about it. The first conversation is free, and you'll get an honest read on the right approach for your situation.
Book a Free ConsultationCurious what the finished thing looks like? Open the live demo dashboard