LoRaWAN Duty Cycle & Airtime: Why Your Network Throttles at Scale
The Limit Nobody Tested For
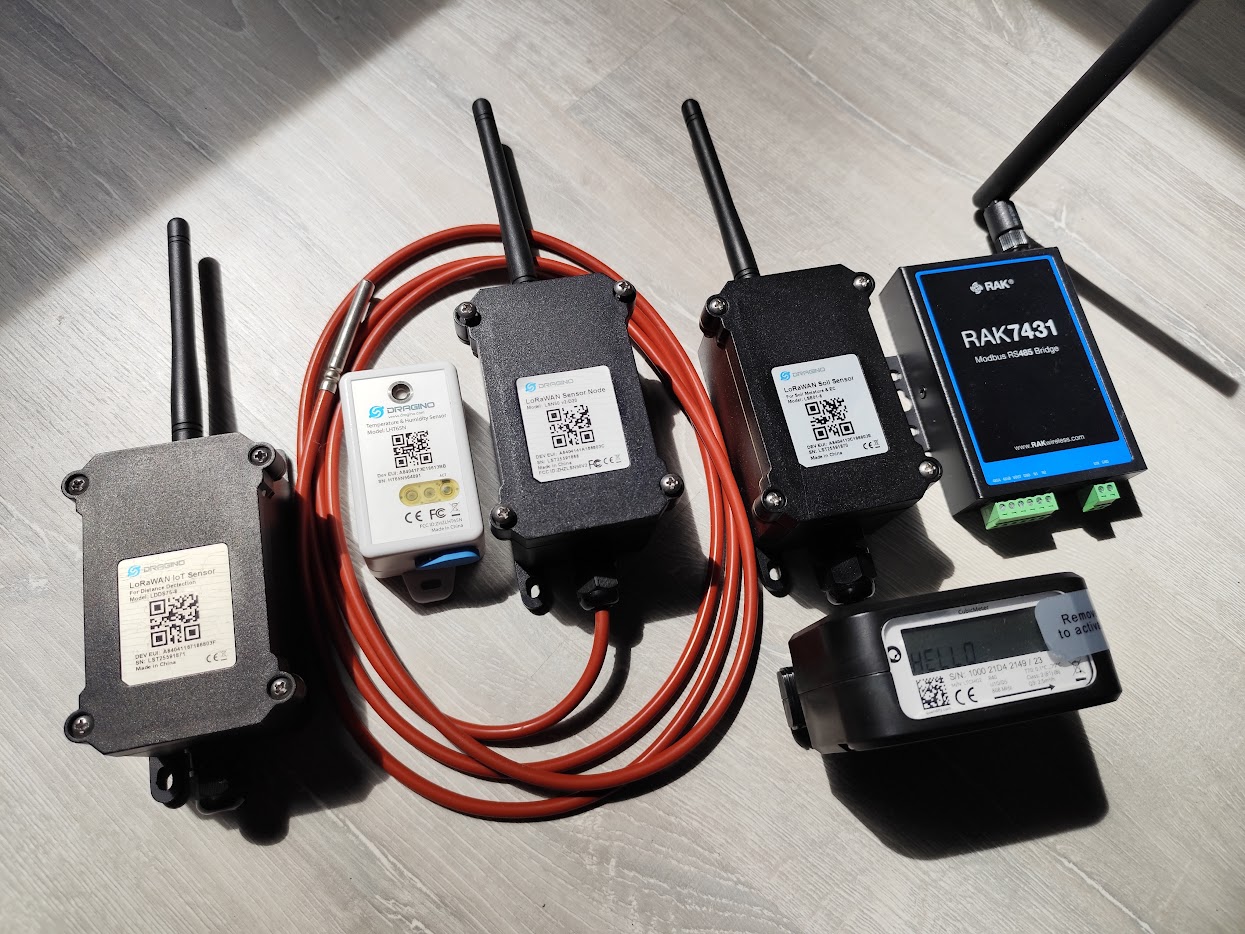
The pilot worked perfectly. Twenty sensors, reporting every few minutes, data flowing cleanly into dashboards. Then the rollout scaled to five hundred devices and reports started going missing, not everywhere, not constantly, but enough to make the data untrustworthy. Coverage tests come back fine. Signal strength is good. The gateways are healthy. So what's wrong?
You've hit an airtime limit. LoRaWAN devices are not allowed to transmit whenever they please. Depending on the region, regulators, and sometimes the network operator, cap how much of the radio spectrum each device may occupy. These limits are generous enough that a small pilot never notices them, and strict enough that a dense or chatty deployment runs straight into a wall. Worse, the symptoms look like a coverage problem, so teams waste weeks chasing the wrong cause.
Airtime is a budget. Every transmission spends some of it. Understanding that budget, how big it is, what each message costs, and how spreading factor and payload size blow through it, is the difference between a network that scales cleanly and one that silently throttles itself. This is the companion to the question of which band you're in; if you haven't picked your region yet, start with LoRaWAN Frequency Plans & Regulations, then come back here to budget the airtime within it.
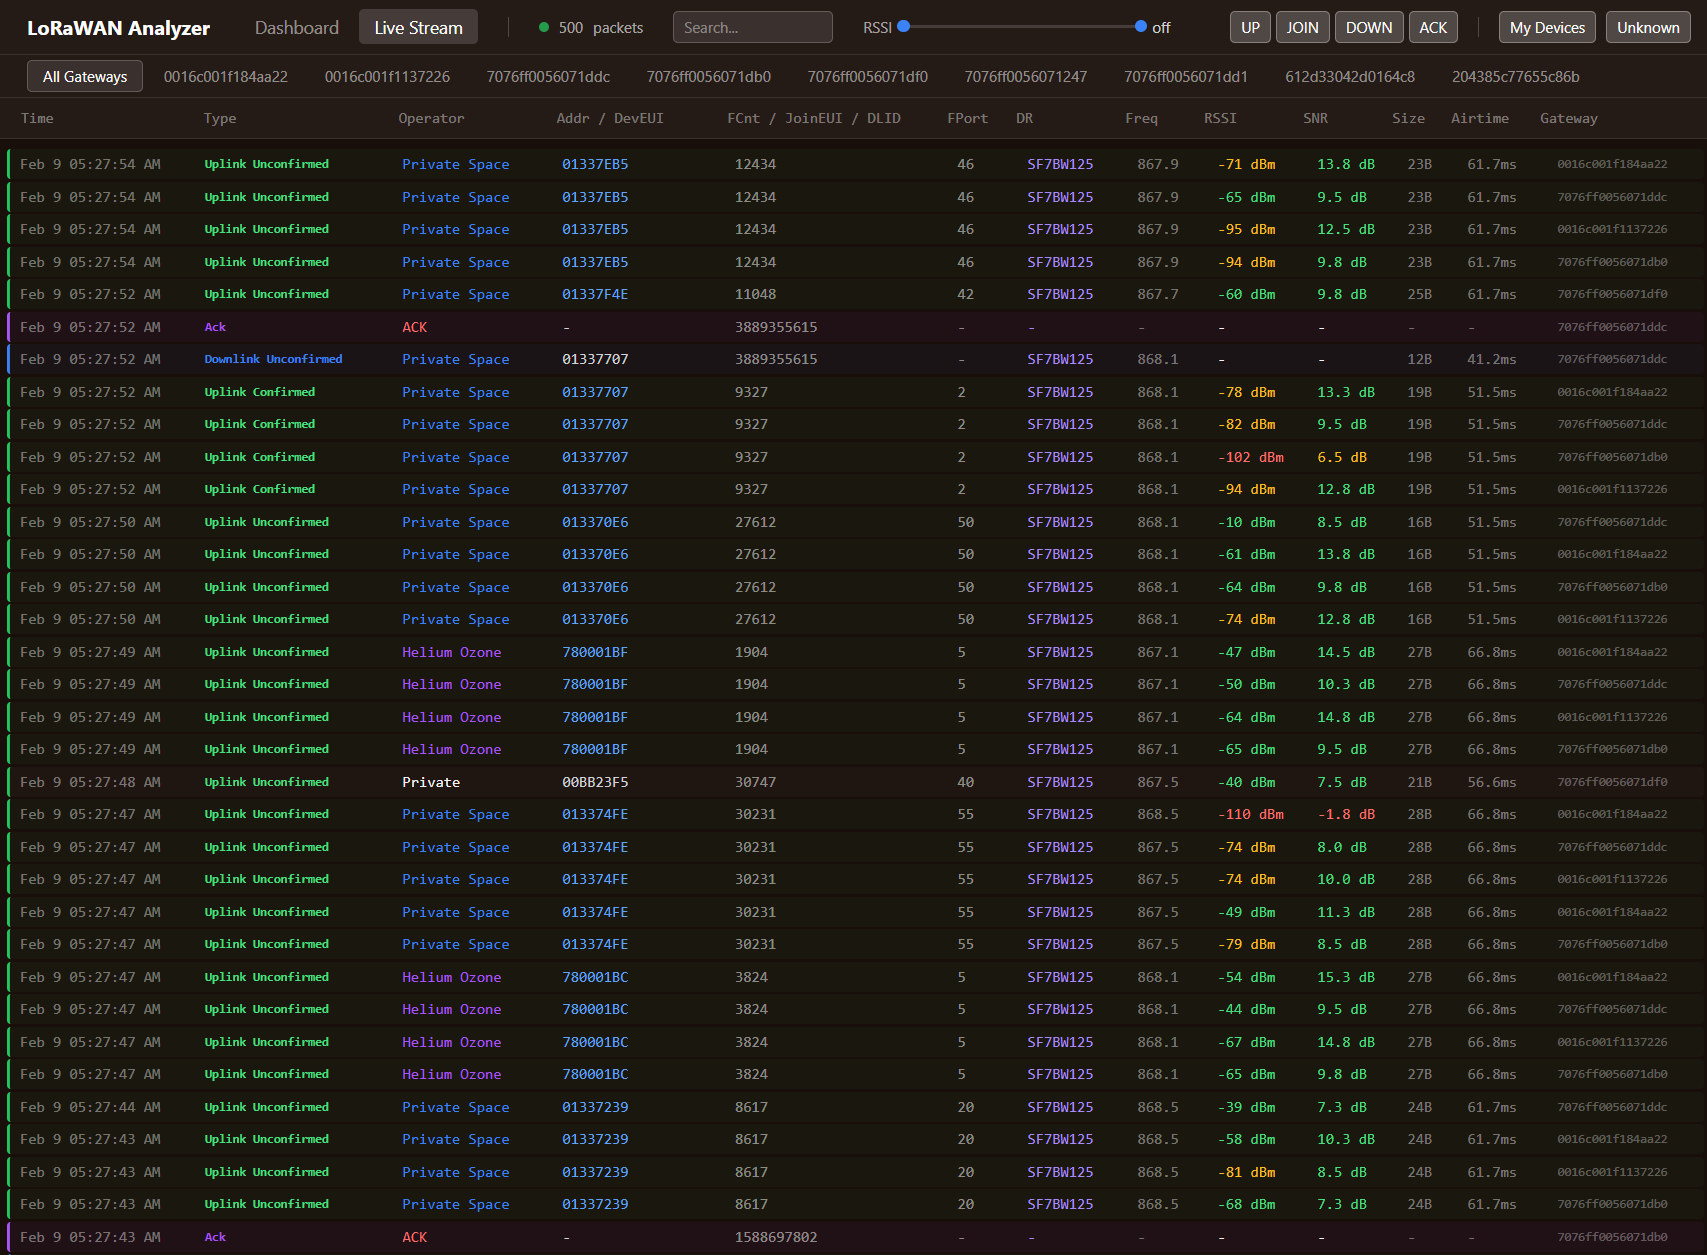
Range gets you connected. Airtime decides how often you're allowed to talk. Most "we scaled and it broke" failures aren't coverage problems; they're airtime budgets nobody calculated.
Two Ways the World Limits Airtime
Regulators everywhere are solving the same problem, stopping a few devices from hogging an unlicensed band, but they use two different mechanisms, and which one applies to you depends entirely on your region.
Duty cycle (Europe / ETSI and similar)
A duty cycle caps the fraction of time a device may transmit. In the EU868 band, the common limit is 1%. The intuition is simple and unforgiving: if a transmission takes 1 second, you must then stay silent for 99 seconds before transmitting again. The regulator doesn't care how you spend it; it caps the total.
Translated into a daily budget, the ETSI sub-band limits work out to:
| Duty cycle | Daily airtime budget |
|---|---|
| 0.1% | ~86 seconds per day |
| 1% | ~864 seconds per day (about 14 minutes) |
| 10% | ~8,640 seconds per day |
Fourteen minutes of airtime a day sounds like plenty, until you do the per-message math below. The duty cycle is enforced per sub-band, and well-behaved device firmware tracks its own usage and backs off when it approaches the limit. That back-off is the throttling: the device isn't broken, it's obeying the law by staying quiet.
Dwell time and frequency hopping (North America / FCC and similar)
In US915 and similar plans, there is no duty cycle. Instead, the FCC requires each transmission to be short (a 400 ms maximum dwell time) and requires devices to hop across many channels so no single frequency is monopolized. You can transmit far more often than in Europe, but every individual message must stay brief, which effectively caps the spreading factor you can use on the 125 kHz channels. The constraint moves from "how much total" to "how long each, and spread it around."
Fair-use policies (the network's own limit)
Even where regulations are generous, the network operator may impose its own cap. The best-known example: The Things Network's public Fair Use Policy limits each device to 30 seconds of uplink airtime per day and 10 downlink messages per day. This is stricter than the EU duty cycle and applies regardless of region on that network. Many teams meet their first airtime wall here, on a community network, long before they'd hit a regulatory one. Running your own network server removes this particular cap, but never the regulatory one.
What a Message Actually Costs: Spreading Factor Is Everything
Here's the part that surprises people: two devices sending the same data can have a 30× difference in airtime cost, purely because of their spreading factor (SF).
A higher spreading factor reaches further and survives weaker signal, but it does so by transmitting the same bits slower, which means longer time on air. Each step up in SF roughly doubles the airtime for the same payload. For a typical EU868 channel (125 kHz, ~10-20 byte payload):
| Spreading factor | Approx. airtime (small payload) | Relative cost |
|---|---|---|
| SF7 (near gateway) | ~40-50 ms | 1× |
| SF9 | ~150-200 ms | ~4× |
| SF12 (far / weak signal) | ~1.3-1.5 s | ~30× |
Now combine that with the airtime budgets. Under TTN's 30-second fair-use cap:
- At SF7, a ~50 ms message means you can send roughly 600 messages per day.
- At SF12, a ~1.5 s message means only about 20 messages per day.
Same network, same rule, same payload, yet a device at the edge of coverage (forced onto SF12) consumes its entire daily budget in twenty messages, while a device next to the gateway barely notices. Airtime cost is dominated by signal quality, and signal quality is dominated by gateway placement. This is the hidden link between coverage planning and airtime: a poorly placed gateway doesn't just weaken signal, it forces high spreading factors that drain every device's airtime budget thirty times faster.
Why It Breaks at Scale and Not in the Pilot
A pilot hides every one of these limits:
It starts with the device count. Twenty sensors rarely strain a budget; five hundred do, especially once they share sub-bands and contend for the same airtime.
Then there is where those devices sit. Pilots get set up in easy, high-signal locations, so everything runs at SF7, the cheapest airtime there is. Production puts devices in basements, far corners and metal-walled rooms, where they climb to SF10, SF11 and SF12, and their airtime cost explodes along the way.
Reporting rates compound both. "Every few minutes" sounds conservative right up to the moment you multiply it by the real device count and the spreading factors those devices actually end up using.
And almost nobody models firmware updates. Sending one over the air is an enormous airtime expense, and a deployment that sits comfortably inside its budget for routine telemetry can blow through the whole thing the first time it tries to push an update to the fleet.
None of these show up at twenty devices on a bench. All of them show up at five hundred in the field. That gap, between a pilot that proves the technology and a production system that respects the airtime budget, is one of the most common places LoRaWAN deployments stall.
Budgeting Airtime Before It Throttles You
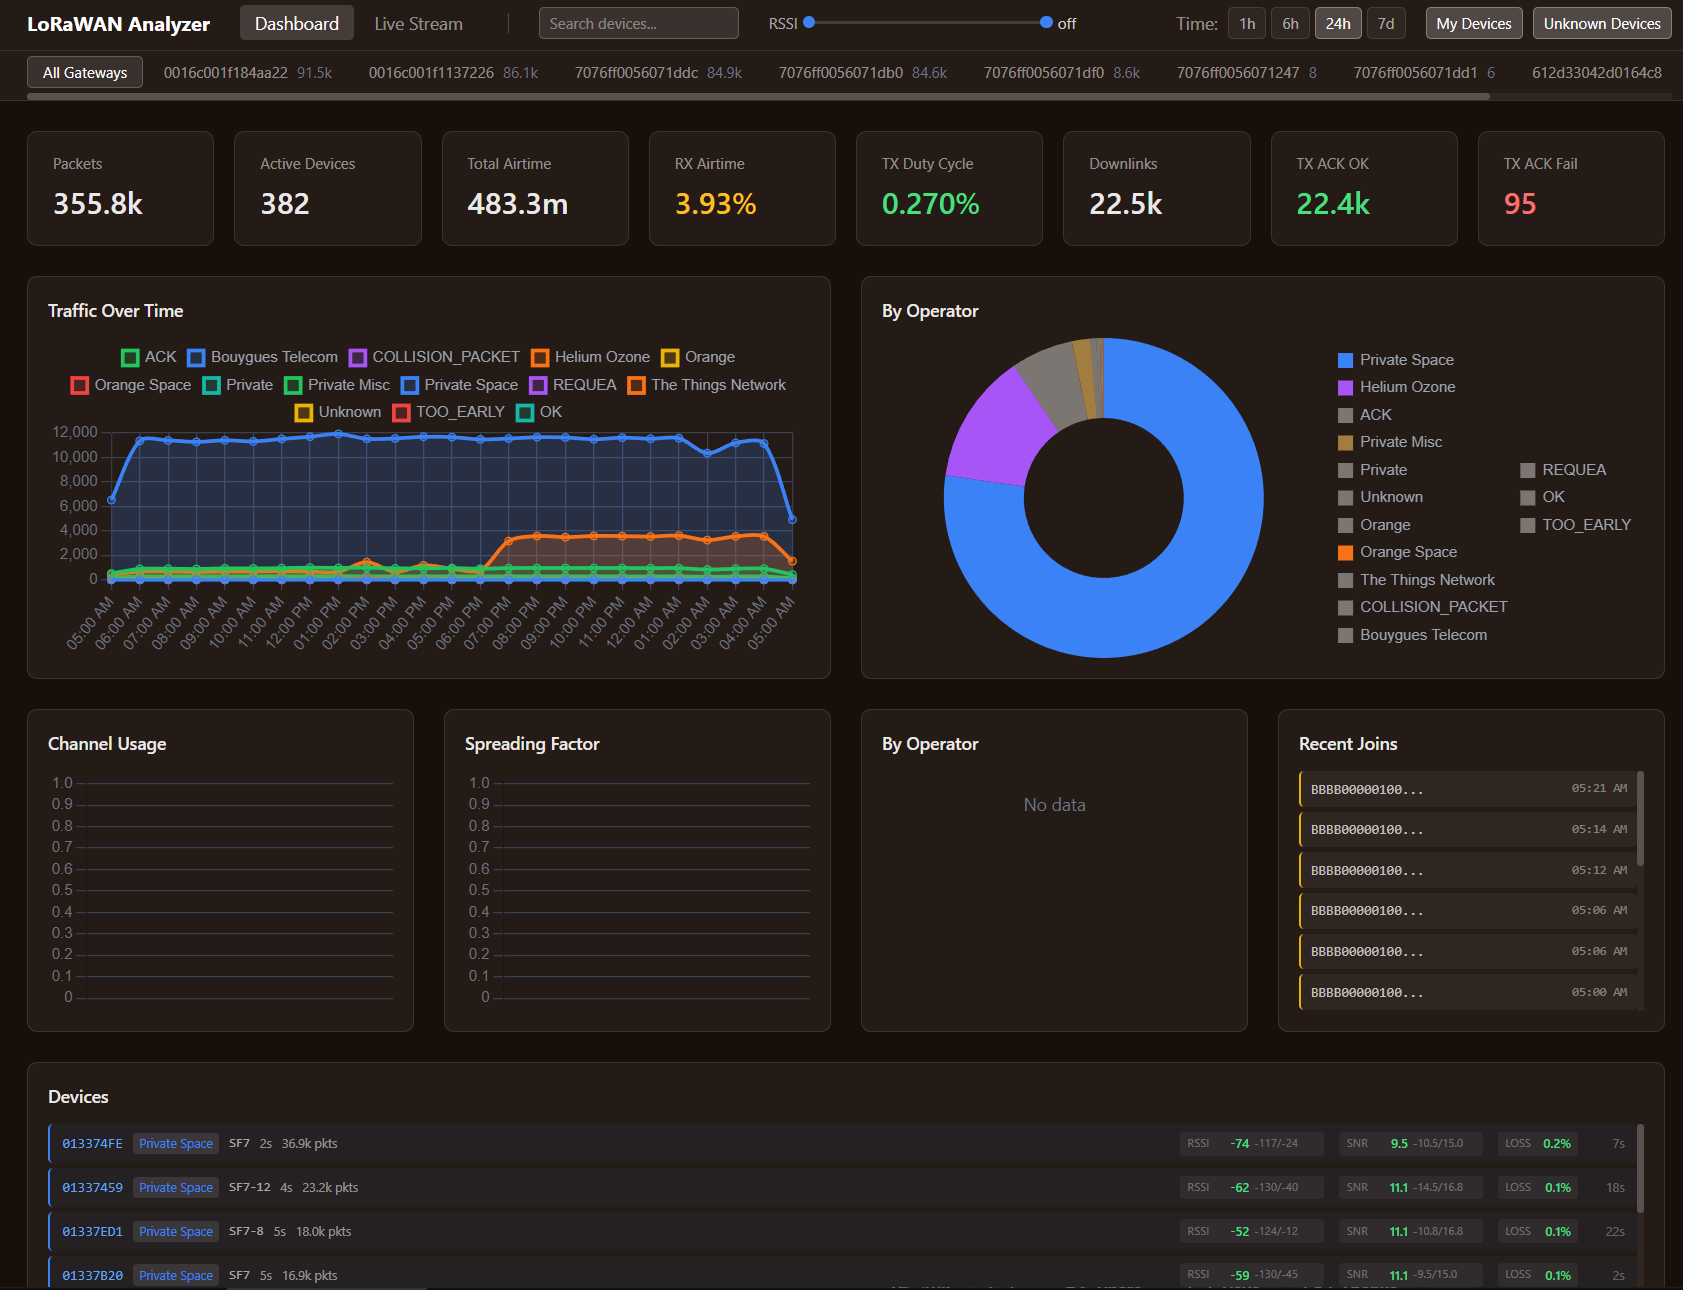
Airtime is predictable. You can calculate it in advance and design within it. A sound approach:
- Know your limit. Identify whether your region imposes a duty cycle (and which sub-band %), a dwell time, or both, and whether your network adds a fair-use cap on top. This follows directly from your frequency plan.
- Estimate real spreading factors, not pilot ones. Base your budget on the spreading factors devices will actually use once they're in their real locations, which means understanding your coverage. Assume edge devices will sit on high SFs.
- Calculate cost per message at those spreading factors, for your real payload size, and multiply by your reporting frequency and device count.
- Right-size the payload and reporting interval. Send less, less often, and let the data justify the airtime. Edge processing, transmitting a computed result instead of raw readings, can cut airtime dramatically.
- Use ADR (Adaptive Data Rate) so devices that can drop to a lower, cheaper spreading factor do. ADR is, among other things, an airtime-optimization tool.
- Improve gateway placement and density. Better coverage pulls devices down to lower spreading factors, which is the single most effective way to reduce fleet-wide airtime consumption. Airtime and coverage planning are the same problem viewed from two angles.
- Plan for FUOTA separately. If you'll update firmware over the air, budget that airtime explicitly; it dwarfs routine telemetry.
Do this on paper and the network scales cleanly. Skip it and you discover the budget the hard way, in production, disguised as a coverage problem you can't find.
What I Provide
Airtime budgeting is where regulation, radio physics, and deployment scale collide, and it's invisible until a network is large enough to hit the wall, at which point it's expensive and confusing to diagnose. Getting it right is design work: calculating the budget up front and architecting the deployment to live within it.
The core of the work is the budget itself: per-message airtime cost, spreading-factor modelling, and fleet-wide capacity for your real device count and reporting rates, applied region by region, duty cycle in EU868, dwell time and hopping in US915 and AU915, fair-use policies where they apply. From there it becomes design: right-sizing payloads and intervals, edge processing that cuts airtime, ADR and network-server tuning that pushes devices onto efficient spreading factors, gateway placement that reclaims airtime by improving coverage, and FUOTA planning that budgets firmware updates without starving telemetry. I also diagnose existing networks that throttle, drop packets, or "broke when we scaled," and train your team to budget airtime for future expansion themselves. Anything delivered comes with source code, documentation, and the calculations to prove the deployment scales, with no vendor lock-in or recurring fees.
I don't sell hardware or charge recurring fees. I help organizations design LoRaWAN networks that scale to their full device count without silently throttling, then hand over the knowledge and the numbers to grow them further.
Already hitting missing packets or throttling you can't explain? An airtime and coverage assessment usually finds the cause quickly, and tells you exactly what has to change before the network grows any larger.
Working on a LoRaWAN project?
If this article touches on something you're building, tell me about it. The first conversation is free, and you'll get an honest read on the right approach for your situation.
Book a Free ConsultationCurious what the finished thing looks like? Open the live demo dashboard