InfluxDB + Grafana Stack for LoRaWAN
Why InfluxDB for LoRaWAN
LoRaWAN generates time-series data. Temperature reading at 10:00, another at 10:15, another at 10:30. Thousands of sensors, all timestamped, all the time.
You can store that in a plain relational table, and at the volumes most deployments actually produce it holds up for a good while. What eventually bites is not the database, it is the naive schema underneath: one table growing forever, one index spanning the entire history, no partitioning and no downsampling. The dashboard that felt instant in month two crawls in year two, and the cause is the design rather than the engine.
InfluxDB solves that by construction. It is built for continuous streams of timestamped measurements, it absorbs millions of datapoints without asking you to think about partitioning, and downsampling and retention are configuration rather than code. For a deployment that is only ever going to store readings, that remains a good answer.
The other way out is to fix the schema instead of changing the engine, which is what PostgreSQL with TimescaleDB does: time partitioning, columnar compression and incremental rollups added to a database that also holds your device registry. That route has its own article, and it is what I reach for more often now. This one covers the InfluxDB stack.
Standard stack I use: LoRaWAN Network Server (ChirpStack) → InfluxDB → Grafana.
Data Pipeline
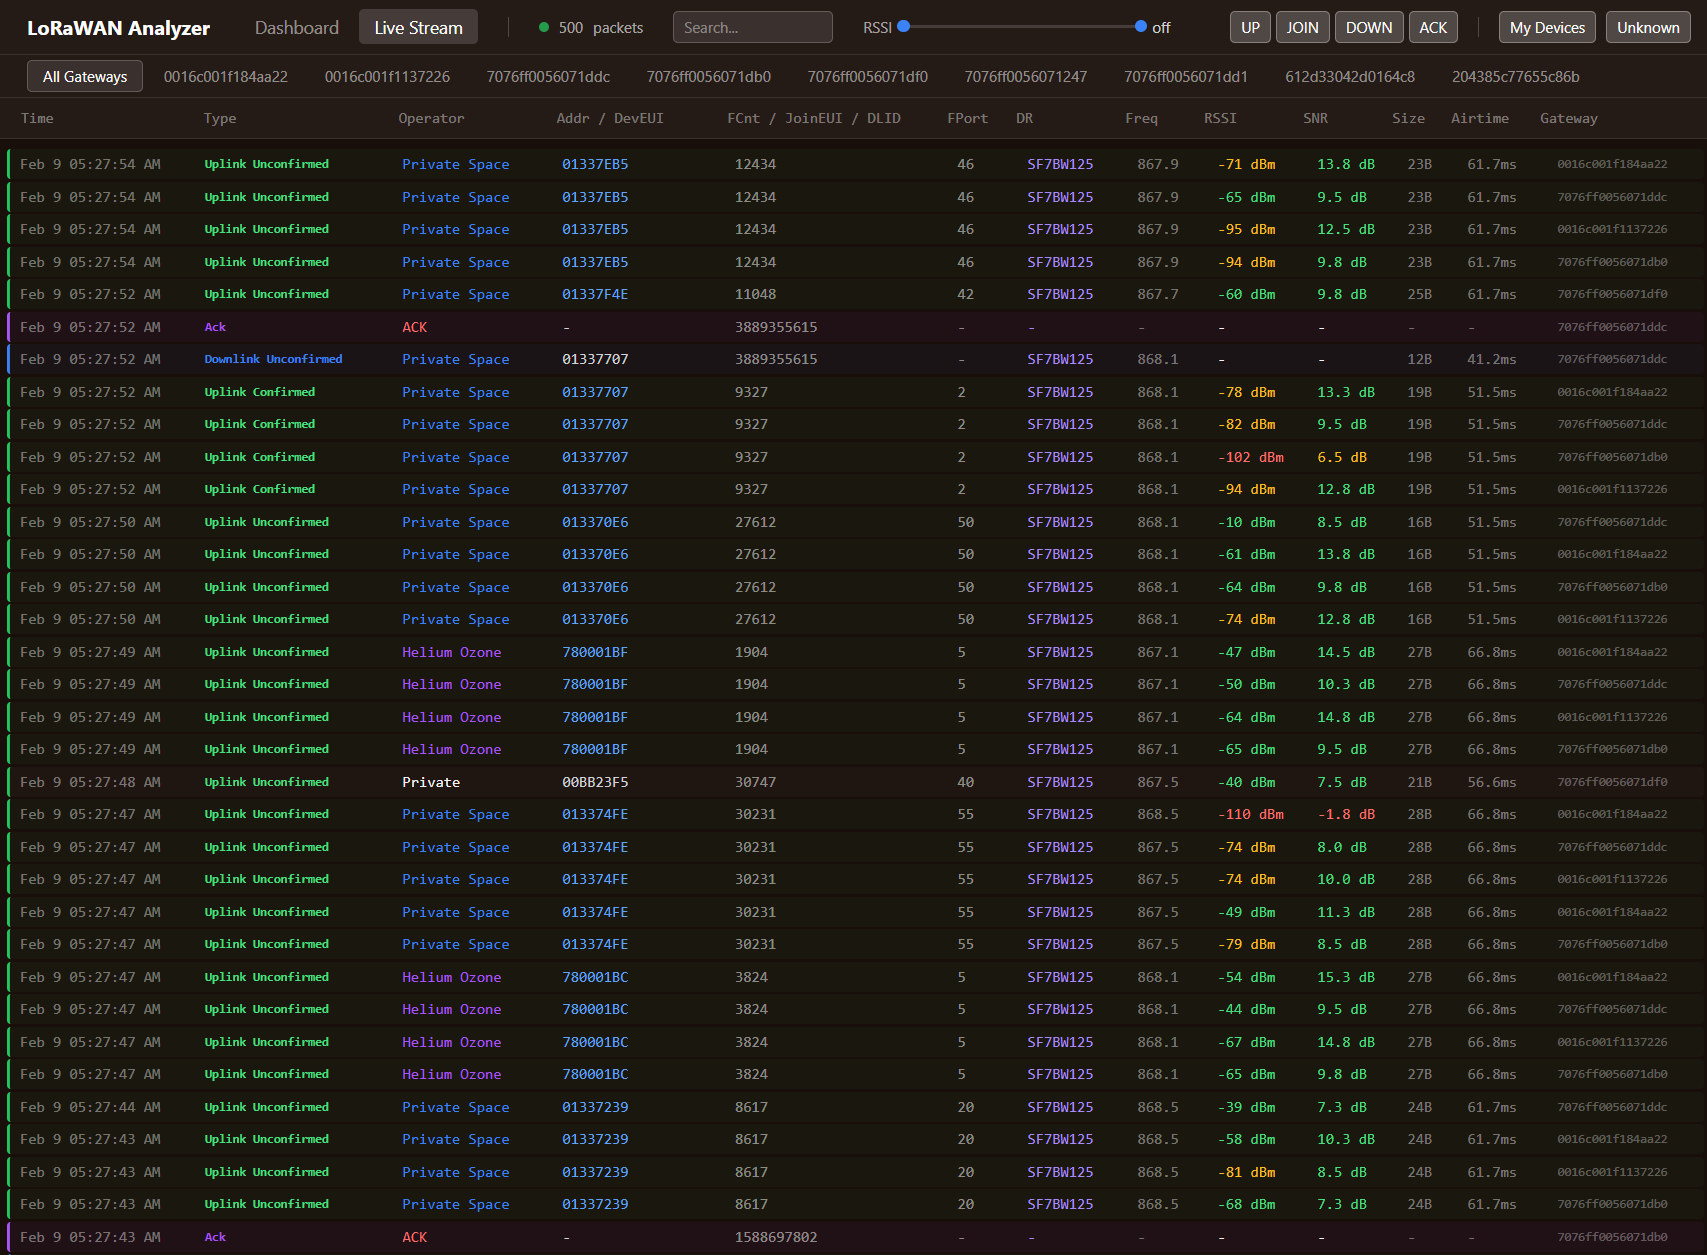
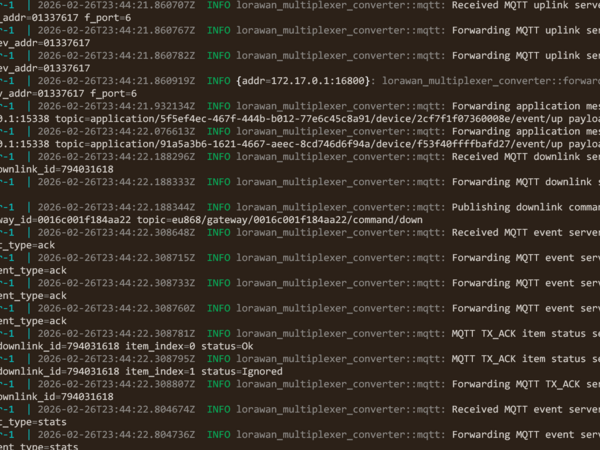
Getting data in depends on which network server you run. ChirpStack provides InfluxDB integration built into the configuration: enable it in the config file and point it at your InfluxDB instance. The Things Network requires middleware since it lacks direct InfluxDB integration: use Node-RED, a custom script, or one of the community integration services. Helium deployments need API polling or a webhook receiver to pull data into InfluxDB. Regardless of source, structure sensor data as measurements tagged with device_id for efficient querying.
The schema itself stays deliberately simple:
measurement: temperature
tags: device_id, location
fields: value (float), battery (int), rssi (int)
timestamp: nanosecond precision
Tags (device_id, location) are indexed, so queries filtering by tags run fast. Fields (value, battery, rssi) store the actual measurements. Timestamp precision at nanosecond level prevents collisions when devices transmit simultaneously.
Grafana Dashboard Design
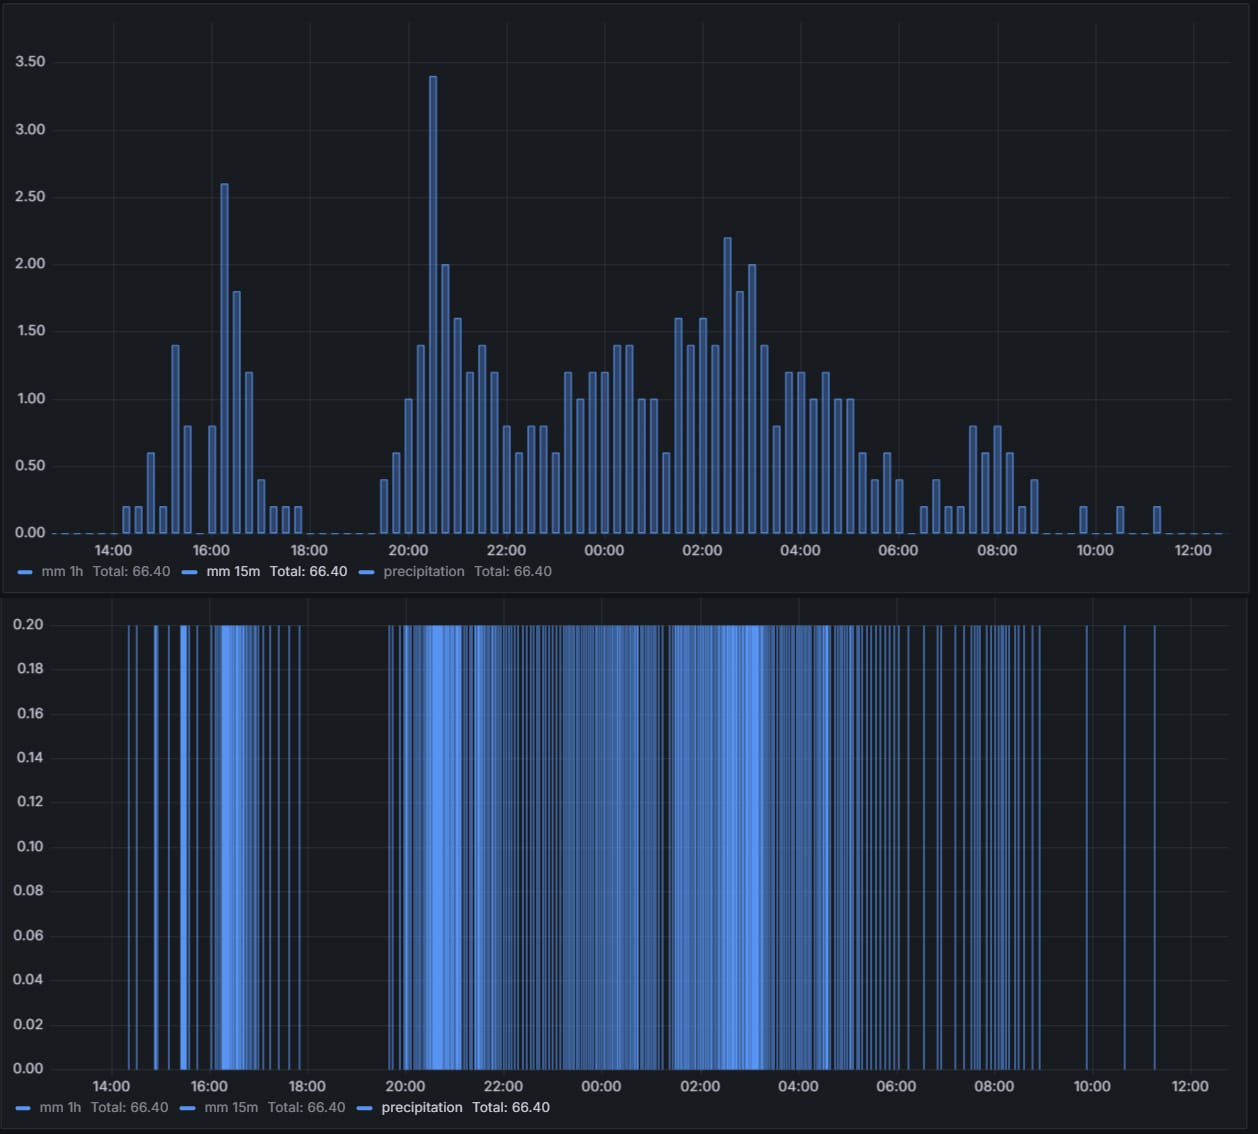
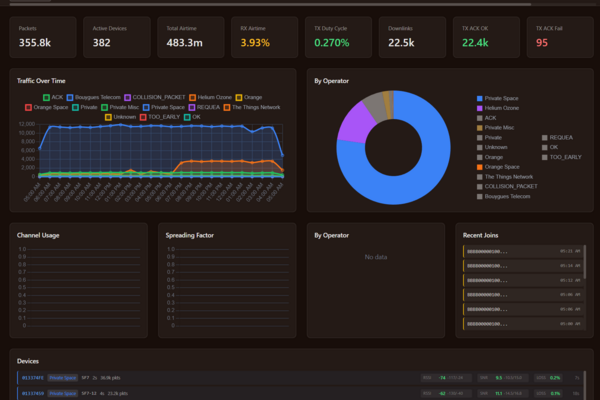
A network health dashboard watches infrastructure reliability: gateway uptime across several windows (last 24 hours, 7 days, 30 days), time-series graphs of packet count per gateway to reveal traffic patterns and any gateway carrying a disproportionate load, a map panel showing gateway locations in status colours (green online, red offline, yellow degraded), and an alert list that surfaces offline devices immediately instead of leaving you to hunt through graphs.
A sensor data dashboard puts current readings front and centre in stat panels, whatever the sensors measure, backs them with historical trend graphs defaulting to 24 hours with selectable ranges for deeper analysis, combines related metrics like temperature and humidity on a multi-axis panel to reveal correlations, and annotates alarm thresholds directly on the graphs so you can see when a reading approached or crossed a limit.
A device management dashboard lists every device with a last-seen timestamp so silent ones stand out, shows remaining charge across the fleet in gauge panels to predict which batteries need replacing soon, tracks RSSI and SNR over time to catch coverage or antenna problems before they cause packet loss, and charts the data-rate distribution (how many devices sit on SF7 versus SF12) to show whether the network is optimized or too many devices have fallen back to slow spreading factors. The demo dashboard has all three views running on real devices, sensor readings on one page and signal quality on another, if you want to see what they look like populated rather than described.
Data Retention
Don't keep raw high-frequency data forever; InfluxDB fills disk fast when storing every reading from hundreds of sensors. Implement tiered retention policies that balance detail with storage costs.
A tiered policy is what keeps that manageable. Raw data at full resolution for 30 days provides detailed recent history for troubleshooting. After 30 days, downsample to 5-minute averages kept for 1 year, sufficient for analyzing trends without storing every single datapoint. Long-term historical analysis uses hourly averages retained for 5 years, capturing seasonal patterns and multi-year trends without consuming terabytes of storage.
InfluxDB continuous queries or Telegraf aggregation handle downsampling automatically. Set up the retention policies once, and the database manages data lifecycle: old raw data expires, aggregations are computed on schedule, and disk usage stays predictable.
Common Mistakes
Not using tags properly. Always tag device_id and location, because tags are indexed and queries filtering by them return in milliseconds. Store either as a field instead and every query scans every record, turning a sub-second lookup into a 30-second wait, and the gap only widens as the dataset grows.
Writing data too frequently. Transmitting every 10 seconds fills the database for no reason, and LoRaWAN's duty-cycle limits make it wasteful anyway. Most monitoring works perfectly at 10-30 minute intervals, which improves battery life dramatically, cuts storage, and still captures the meaningful trends, so reserve high-frequency transmission for the applications that truly need it, like vibration monitoring or leak detection.
Not monitoring InfluxDB itself. Use Telegraf to watch the database's own CPU, memory, and disk, because if it goes down you lose all incoming data until you notice and restart it. Alert on high CPU, low disk, and degrading query performance: your time-series database deserves the same monitoring as the sensors it stores.
What I Provide
I set up the whole pipeline: time-series database configuration, the data path from network server to storage, dashboard design, query and performance tuning, retention policies, and alert rules that have actually been tested, plus custom integrations where your stack needs them. The infrastructure is self-hosted and yours, along with the configuration documentation, dashboard templates, and integration code, with no licensing fees.
I don't push specific tools. If your stack uses PostgreSQL with TimescaleDB, Prometheus, or other time-series solutions, I work with what you have. The goal is reliable data storage and useful visualization, not forcing a particular technology stack.
Working on a LoRaWAN project?
If this article touches on something you're building, tell me about it. The first conversation is free, and you'll get an honest read on the right approach for your situation.
Book a Free ConsultationCurious what the finished thing looks like? Open the live demo dashboard