LoRaWAN Weather Station Systems
Good Hardware, Bad Data
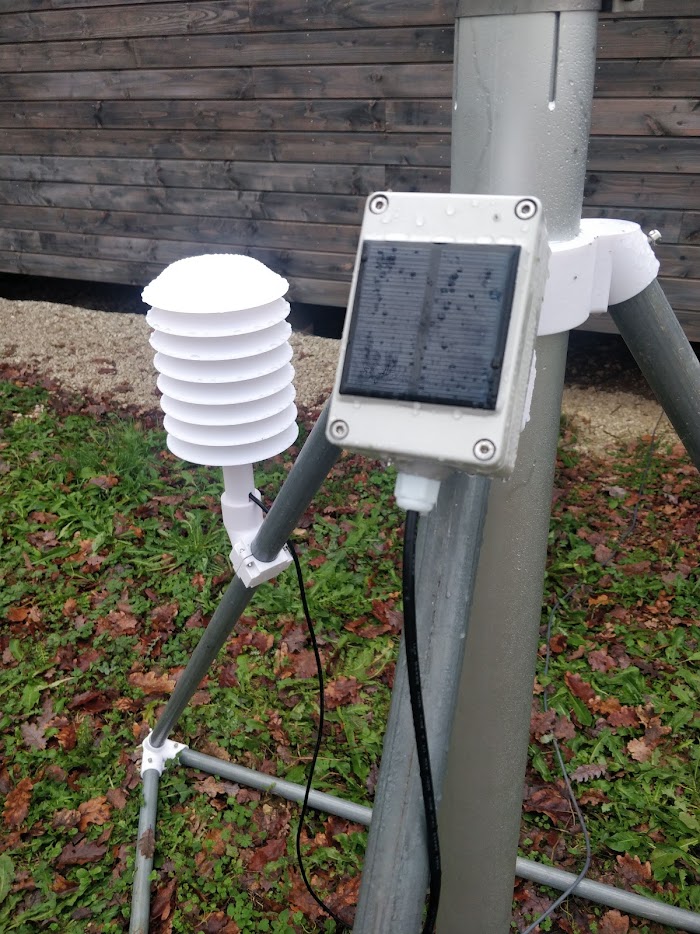
A weather station is only as good as its installation. A rain gauge placed near a building undercounts by 30%, because wind turbulence throws rain away from the funnel. A temperature sensor without a radiation shield reads 10-20°C above the real air temperature in direct sun. The sensors work fine; the placement is what produces garbage data.
Get the physical siting right and LoRaWAN handles the rest well: long range on unlicensed spectrum, years of autonomous solar operation, and data flowing straight into your own dashboards. This guide covers the components, the accuracy that each application actually needs, and the placement mistakes that quietly ruin otherwise good measurements.
System Components
A basic station starts with a BME280 measuring temperature, humidity, and barometric pressure to ±0.5°C and ±3% RH, enough for most monitoring, plus a tipping-bucket rain gauge at 0.2 mm resolution that's accurate enough for agriculture and flood prediction. A solar panel and battery give it long-term autonomous operation off-grid, and the LoRaWAN transmitter carries the data back, with range depending on terrain and gateway placement.
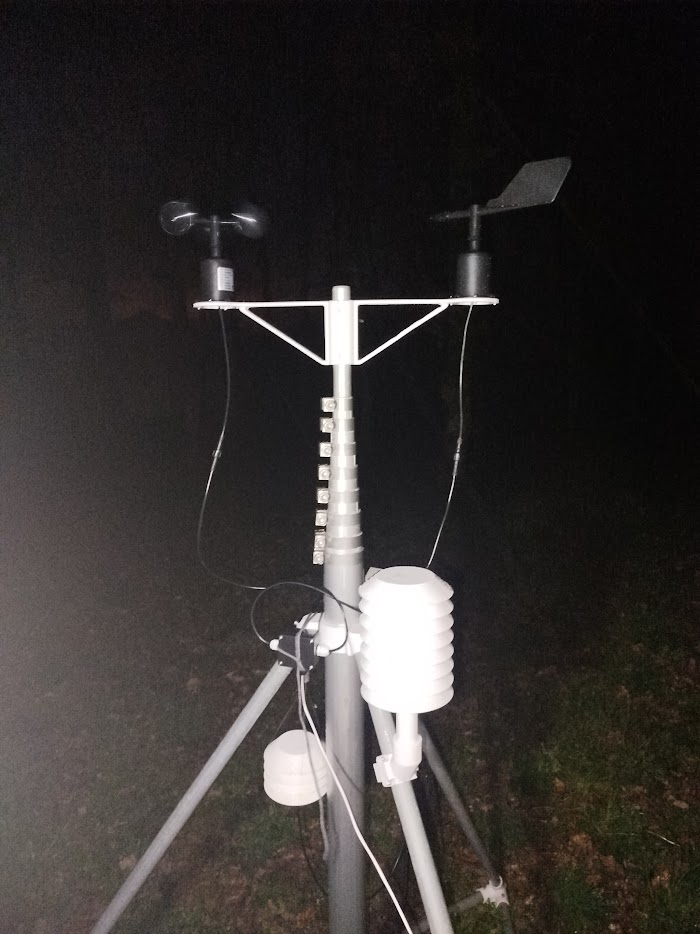
An advanced station adds wind and more: a cup anemometer resolving wind speed to 0.5 m/s, a wind vane giving 16-point direction (critical for spray timing and site assessment), a UV sensor for solar radiation, and a soil-moisture probe at 30 cm depth to monitor the root zone, closing the loop between weather data and what the plants actually need.
Temperature, Humidity, Pressure
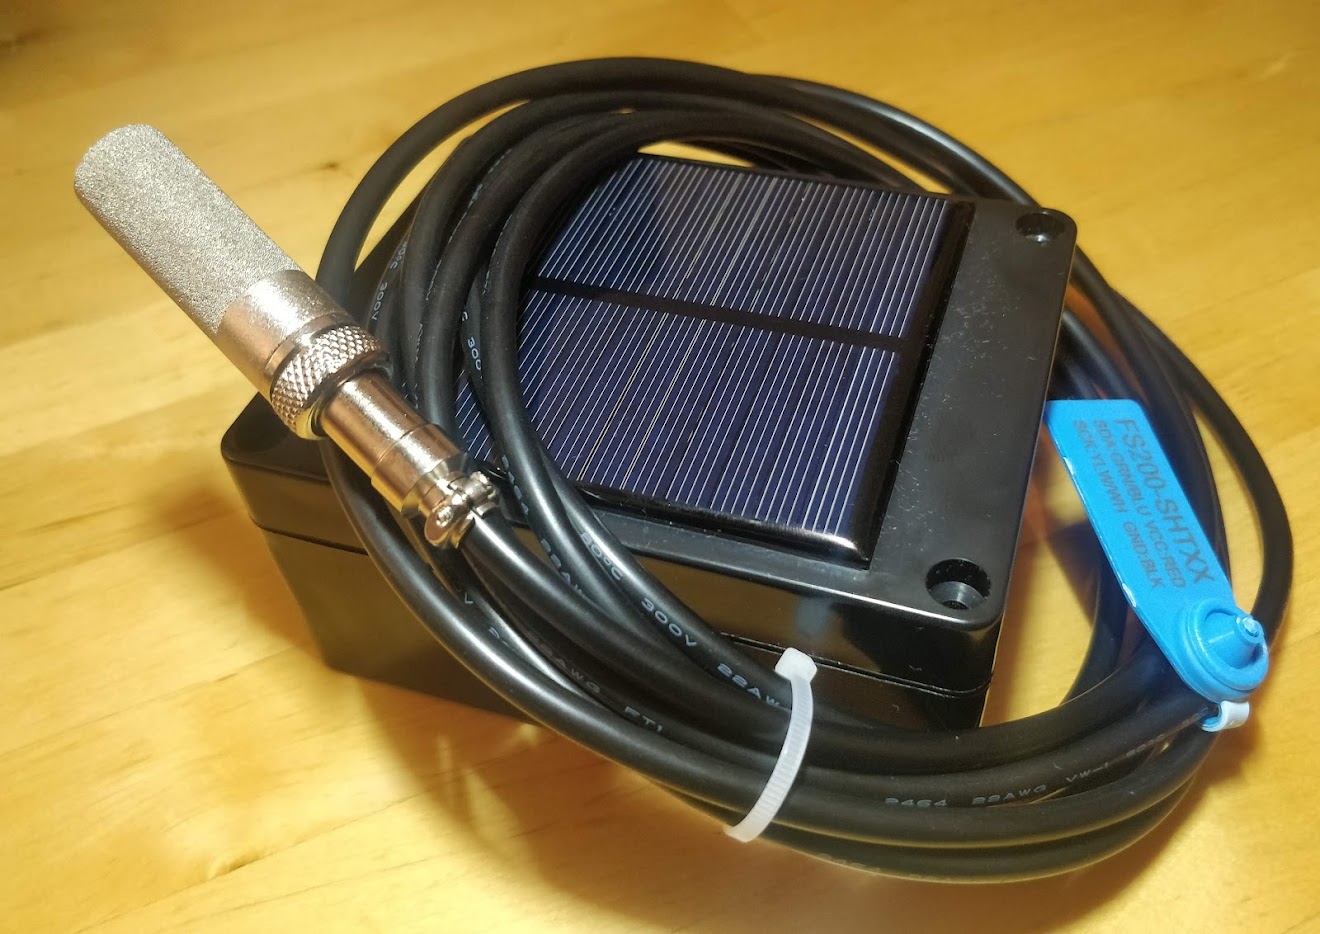
Match sensor accuracy to the job. A DHT22 at ±2°C is fine for irrigation timing, where the trend matters more than the exact figure; a BME280 at ±0.5°C suits HVAC control, where half a degree affects efficiency; and industrial sensors like Vaisala provide traceable calibration certificates when regulatory compliance or an insurance claim needs documented accuracy.
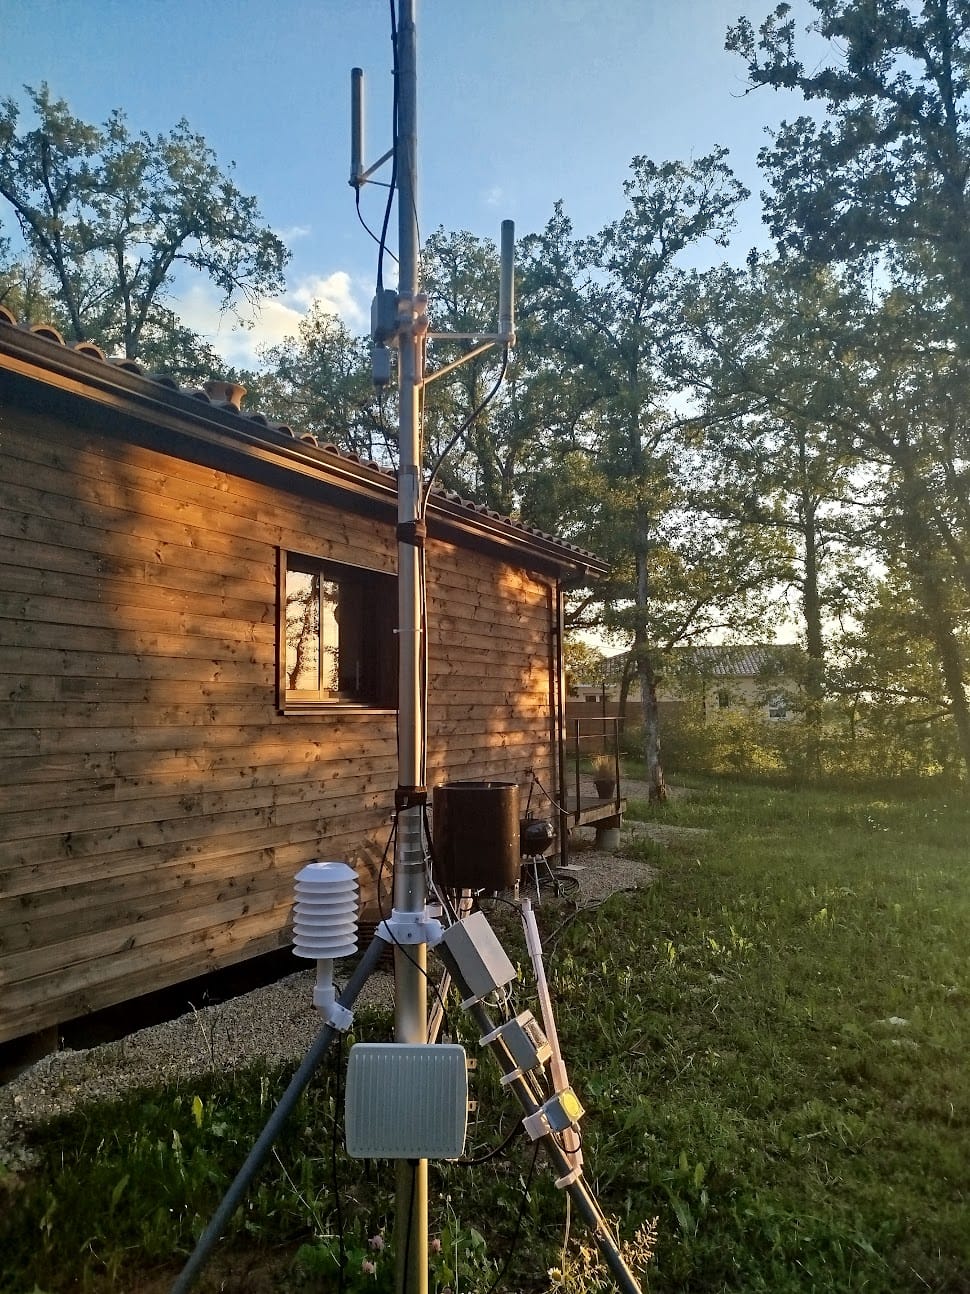
Placement is where readings are made or ruined. A radiation shield is mandatory, since direct sun on the sensor produces false readings 10-20°C above actual air temperature, so use a white, ventilated shield that allows airflow while blocking radiation. Keep well clear of heat sources: rooftops absorb and re-radiate heat, concrete adds thermal mass, exhaust vents blow warm air. Mount at the meteorological standard of 1.5-2 m so the reading represents ambient conditions rather than a ground-level or rooftop microclimate.
Rain Measurement
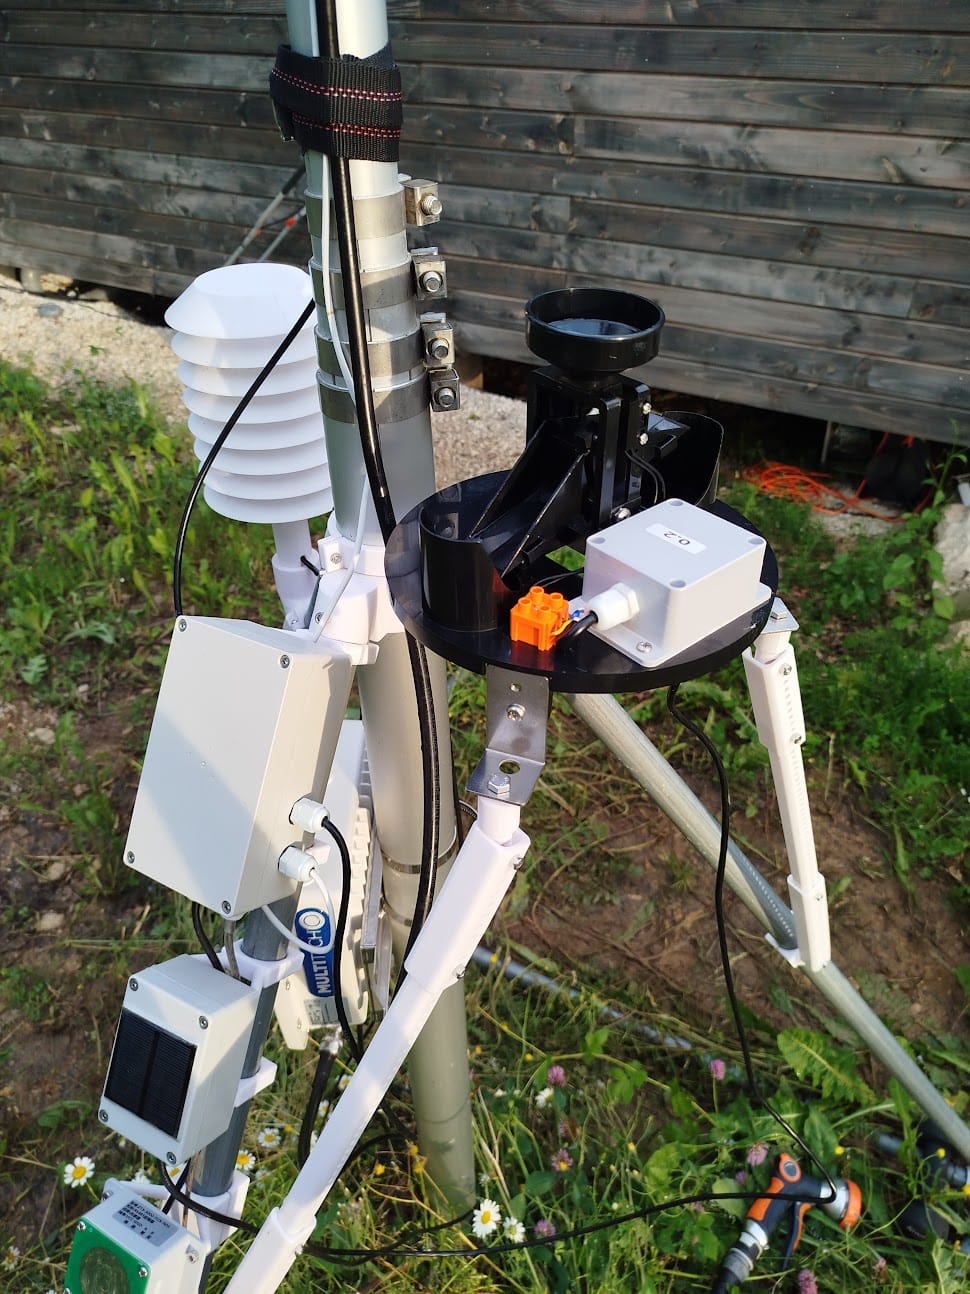
A tipping-bucket gauge works by filling until it accumulates 0.2 mm or 0.5 mm, then tipping, emptying, and registering a count; there's no calibration drift, and it runs for years. Choose 0.2 mm resolution for agriculture and flood prediction, where catching drizzle and measuring intensity accurately matters, and 0.5 mm for general monitoring where precise intensity isn't critical and simplicity and cost win. Davis, Onset, and Pessl Instruments all make gauges that pair with a LoRaWAN pulse counter, and transmission intervals of 10-30 minutes balance freshness against multi-year battery life.
Placement, again, is decisive. Install in the open with no obstruction within 4× the gauge height, because trees and buildings create turbulence that throws rain clear of the funnel; a poor location undercounts by around 30%. Level the gauge within 2 degrees, since any tilt causes systematic undercounting, mount it at the standard 1-1.5 m with clear line-of-sight to the gateway, and keep it accessible, because funnels clog and need roughly monthly cleaning.
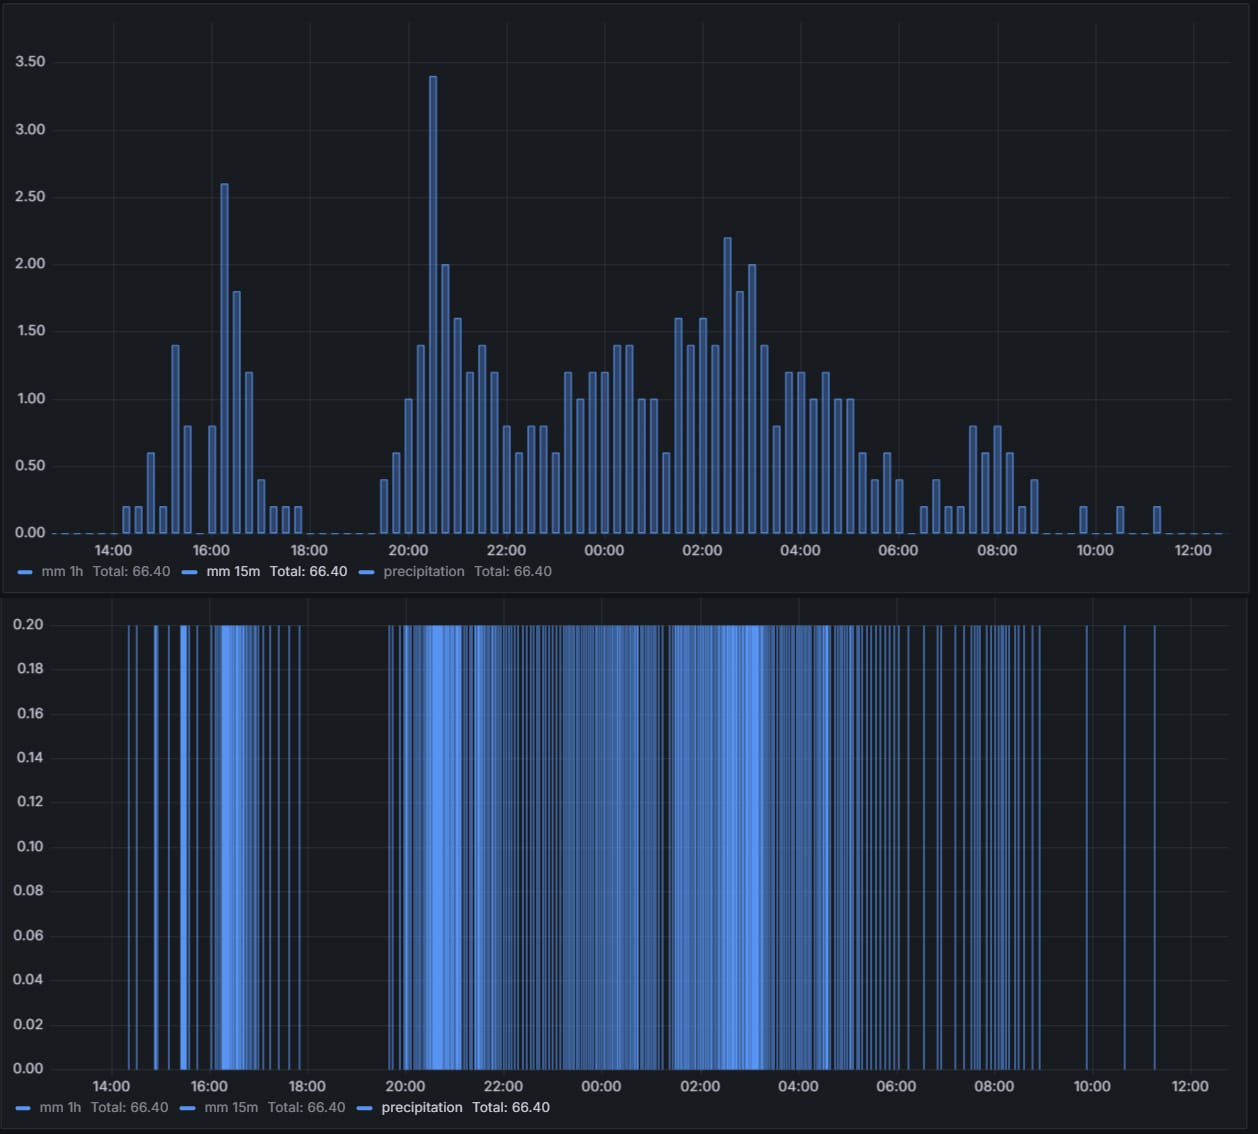
From the raw tips, calculate running totals across several timeframes (1 hour, 24 hours, 7 days, 30 days) to reveal both immediate storms and seasonal patterns, and derive intensity in mm/hour to classify severity: 20 mm spread over 6 hours soaks in and helps, while 20 mm in 30 minutes runs off, eroding soil and flooding. That intensity data drives real decisions. Frost-protection systems activate sprinklers only when rainfall drops below 2 mm/hour, saving 60-70% of water versus manual operation; urban flood prediction triggers pumps once readings exceed 15 mm/hour, 20-30 minutes faster than rainfall radar alone; and calibrated, GPS-timestamped records resolve insurance disputes with verifiable precipitation data.
Wind Monitoring
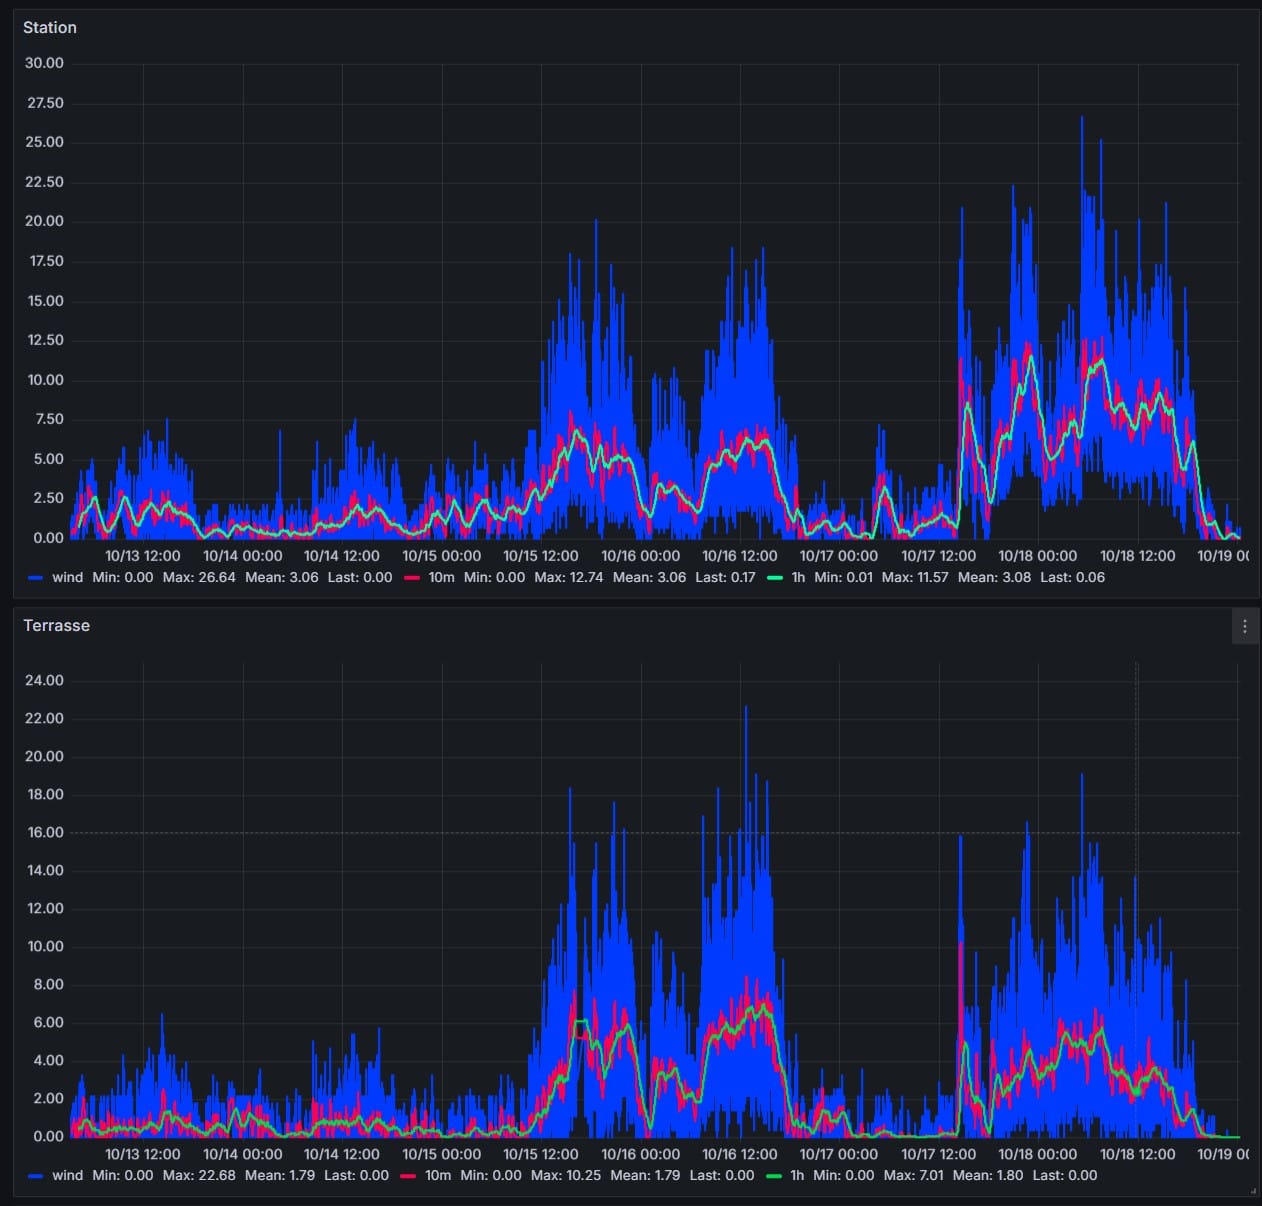
Three sensor types cover the range of needs. Cup anemometers are the standard for long-term monitoring, a 3-cup design with a 0.5 m/s threshold and ±0.3 m/s accuracy from brands like NRG, Thies, and Vector Instruments, though bearings wear out every 2-3 years in harsh conditions. Sonic anemometers have no moving parts, use ultrasonic time-of-flight to measure the full 3D wind vector, cost more but are maintenance-free apart from cleaning, and handle icing better. Wind vanes use a potentiometer or magnetic encoder and mount above the anemometer to avoid its wake.
Height and siting determine whether the data means anything. Agricultural stations sit at 2-10 m where crops meet the wind; wind-energy assessments need hub height, typically 40-120 m, since speed rises with altitude; environmental monitoring uses 10 m as the reference; and a building-mounted sensor must sit at least 2× the building height above the roofline to clear the turbulence the structure itself creates. In all cases you want open terrain with no obstruction within 10× the sensor height, because building edges, tree lines, and terrain features corrupt the reading, leaving you measuring local disturbance rather than actual wind.
The applications are demanding. Turbine site assessment needs 1-2 years of hub-height data, because a regional estimate can overstate the resource by 30% through local terrain effects and cost hundreds of thousands in miscalculated ROI. Spray operations require wind below 5 m/s to prevent drift, frost protection triggers on combined wind and temperature thresholds, crane operation limits typically fall at 12-15 m/s for safety, and aviation stations watch for the wind shear that affects takeoff and landing. The outputs support all of this: average speed and peak gusts, direction in degrees from north, standard deviation as a turbulence indicator, wind roses on 16- or 36-point diagrams, and Weibull fits with power-density calculations for energy work.
Keeping it accurate is ongoing. Cup bearings wear fastest in coastal or dusty air and need replacing every 18-24 months, sonic units need annual cleaning (spider webs between the sensors cause errors), agricultural stations benefit from an annual field calibration check, and wind-energy installations require certified laboratory calibration every 1-2 years.
Data Pipeline
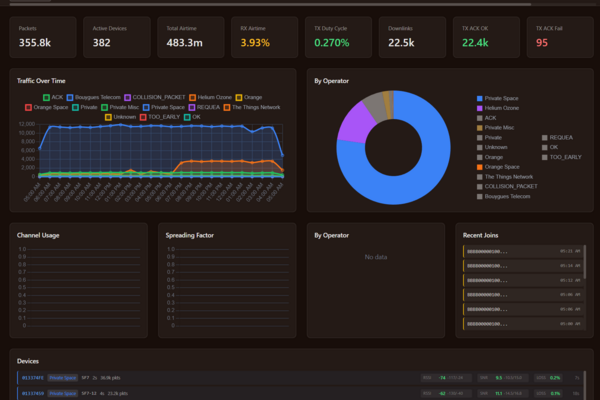
The standard flow is LoRaWAN → ChirpStack → InfluxDB → Grafana, with transmission intervals of 1-10 minutes set by the application, frequent for irrigation control, longer for seasonal monitoring. Local alerting catches out-of-range values immediately so notifications fire before a problem escalates, historical comparison charts current conditions against the same period last year to expose anomalies and trends, and API access lets automated systems, irrigation controllers, HVAC, frost protection, query current conditions and adjust operation. The database computes the derived metrics, cumulative rainfall, intensity, wind-rose distributions, automatically. A station sits on the demo dashboard reporting through that same pipeline, which shows how the readings settle once a real one is in the field rather than on a bench.
Real Applications
Across agriculture, multiple stations map the microclimates over a property, and the temperature variation feeds planting-density and yield decisions. Ski resorts place stations at different altitudes to track temperature and snow depth and run snowmaking compressors only when it's worth it (below -2°C, under 60% humidity). Urban planners map temperature across neighbourhoods to identify heat islands and target greening. And in renewable energy, months of site-specific wind data beat any regional estimate, since the ROI calculation lives or dies on an accurate wind-speed distribution.
Hardware Components
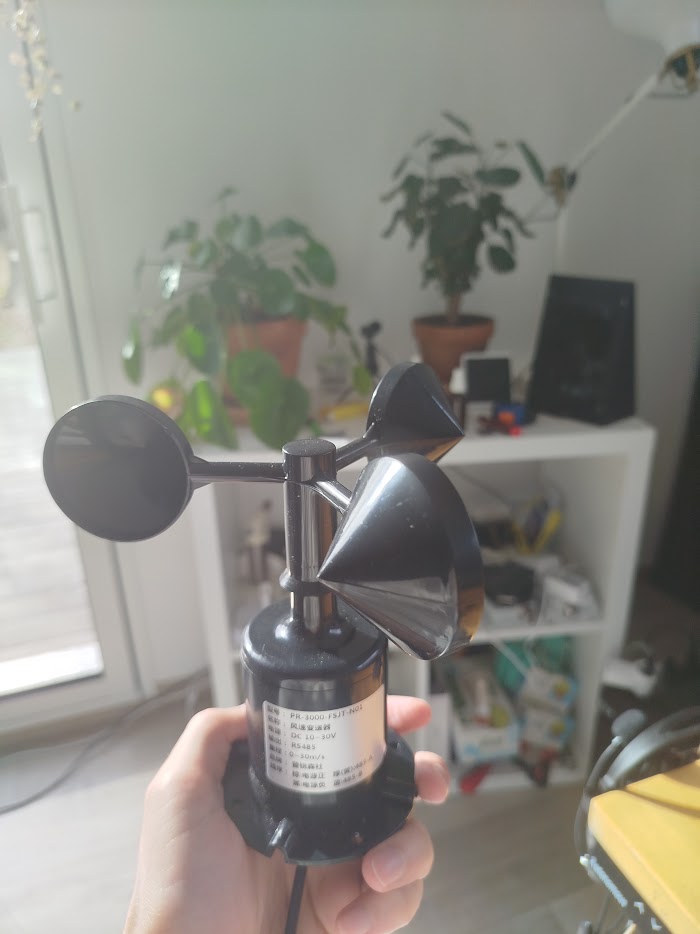
You source the hardware directly: a BME280 or equivalent for temperature, humidity, and pressure; a tipping-bucket gauge from Davis, Onset, or Pessl Instruments; a cup or sonic anemometer depending on your maintenance appetite and budget; a wind vane where direction matters; a LoRaWAN transmitter with analog and pulse inputs to interface the sensors; a solar-and-battery system for autonomous power; masts, mounting hardware, and lightning protection for tall installs; and a LoRaWAN gateway where coverage doesn't already exist. As always, LoRaWAN range varies with terrain, antenna height, and gateway placement, battery life depends heavily on transmission frequency and conditions, and solar sizing follows from latitude, seasonal sun, sensor draw, and how much cloudy-period autonomy you want.
I specify what you need from your accuracy requirements, environment, and application, help you source the right components, and integrate them into a working system. I don't sell the hardware.
What I Provide
I build weather monitoring systems end to end: sensor selection against your accuracy requirements, site assessment and placement, network design, the data pipeline, and dashboards with alerting and whatever statistical processing your application needs, integrated with existing automation where you have it. Everything is yours afterwards, source code, self-hosted infrastructure, documentation, and calibration procedures, with no licensing fees.
I don't push specific hardware brands or software platforms. If you prefer different sensors, an alternative database, or custom visualization tools, I work with whatever suits your requirements and budget.
Working on a LoRaWAN project?
If this article touches on something you're building, tell me about it. The first conversation is free, and you'll get an honest read on the right approach for your situation.
Book a Free ConsultationCurious what the finished thing looks like? Open the live demo dashboard